How to Import Excel Data into Canva Presentations
Excel data can make a presentation more useful, but moving tables and charts from a spreadsheet into Canva is not always simple. You may need to upload files, add tables, or bring in charts without losing their original layout.
Formatting issues can make the process harder. Fonts, colors, borders, and chart quality may change after import. Manual adjustments can also take extra time, especially for large spreadsheets or reports.
Canva offers several ways to work with Excel data. This guide explains how to upload Excel files, import tables and charts, use Bulk Create, and edit imported elements. You'll also learn how to fix common import issues and present spreadsheet data through clear, easy-to-read visuals.
How to Add and Import Excel Data to Canva
Canva lets you add Excel data to your presentation in a few ways. You can upload an Excel file, add a table, or bring in a chart. Each method works well for different types of content. The right choice depends on how you want to show your data.
How to Upload an Excel File to Canva
Start by uploading your Excel file to Canva. This gives you access to the file inside your Canva workspace.
- Open Canva and sign in to your account.
- Open the presentation where you want to add Excel data.
- Click Uploads in the left-side panel.
- Select Upload files.
- Find your Excel file on your computer. Select it and click Open.
- Wait for the upload to finish.
Your file will now appear in the Uploads panel. You can access it from there. Keep in mind that uploading an Excel file does not always turn its contents into editable table elements. You may need to copy the data or use another import method to add it to your slides.
How to Insert an Excel Table in Canva
A table can help you present rows and columns of data in a clear format. You can copy cells from Excel and paste them into a Canva table.
Follow these steps:
- Open your Excel workbook.
- Select the cells you want to add to your presentation.
- Press Ctrl + C on Windows or Command + C on Mac.
- Open your Canva presentation.
- Select the slide where you want to add the table.
- Click Elements in the left-side panel.
- Search for Table and select a table layout.
- Click the table and add the copied data to its cells.
You can adjust the table's size, font, text color, and cell colors. You can also change the row height and column width to fit your content. Check the table after pasting the data. Make sure each value appears in the correct cell. Large tables may need smaller text or more than one slide.
How to Import an Excel Chart into Canva
Charts help you present numbers in a visual format. You can use them to show sales figures, survey results, budgets, or other data.
You can copy an Excel chart and paste it into Canva as a visual element.
- Open your Excel workbook.
- Select the chart you want to use.
- Copy the chart using Ctrl + C or Command + C.
- Open your Canva presentation.
- Go to the slide where you want to place the chart.
- Press Ctrl + V or Command + V to paste it.
- Adjust the chart's size and position on the slide.
Check the pasted chart to make sure its labels, values, and colors look correct. The chart may appear as an image rather than an editable chart. You can also recreate it with Canva's chart tools if you need to change its data or design.
How to Handle White Backgrounds in Imported Excel Data
An imported Excel table or chart may have a white background. This can look out of place on a slide with a colored or textured design.
You can use a few simple methods to fix this issue.
Change the Canva slide background: Use a white or light-colored slide background to match the imported Excel content. This can make the table or chart look more consistent. Use Canva's background removal tool: If your imported chart is an image, you may be able to remove its white background with Canva's background removal feature. This feature may require a paid plan.
Crop extra white space: Select the imported image and use Canva's crop tool. Remove unused space around the chart or table. Recreate the chart in Canva: For more control, create a new chart with Canva's chart tools. Add the same data and choose colors that match your presentation. Always check the final slide in presentation mode. Make sure the imported data is easy to read and fits the rest of your design.
How to Export Excel Charts as SVG
Excel charts can be saved as SVG files. This format keeps charts clear at different sizes. It also makes them easier to resize in Canva without losing image quality. You can use this method to add charts to your presentation as separate visual elements.
How to Export Excel Charts as SVG
Follow these steps to save an Excel chart as an SVG file:
- Open your Excel workbook.
- Select the chart you want to export.
- Right-click the chart and select Copy.
- Open a graphics editor that supports SVG files.
- Paste the copied chart into the editor.
- Select the option to save or export the chart.
- Choose SVG as the file format.
- Enter a file name and save the file to your computer.
Your chart is now ready to use in Canva. Keep the SVG file in an easy-to-find folder for the next steps.
How to Upload and Use SVG Charts in Canva
Canva lets you upload SVG files and add them to your presentation. Follow these steps:
- Open your Canva presentation.
- Go to Uploads from the left sidebar.
- Select Upload files.
- Find the SVG chart on your computer.
- Select the file and wait for it to upload.
- Drag the uploaded chart onto your slide.
- Resize and position it to fit your layout.
You can adjust the chart size without making it look blurry. Keep the chart large enough to read. Use a clear position so it does not cover other slide content.
Choosing the Right Excel-to-Canva Import Method
Canva supports different ways to add Excel data and charts to a presentation. The right method depends on how you plan to use the content.
Copying and pasting works well for simple tables and small data sets. It can save time during slide creation. Uploading an Excel file is another option for adding data to your Canva project. SVG files are a good choice for charts that need clear lines and labels at different sizes.
Here is a quick comparison:
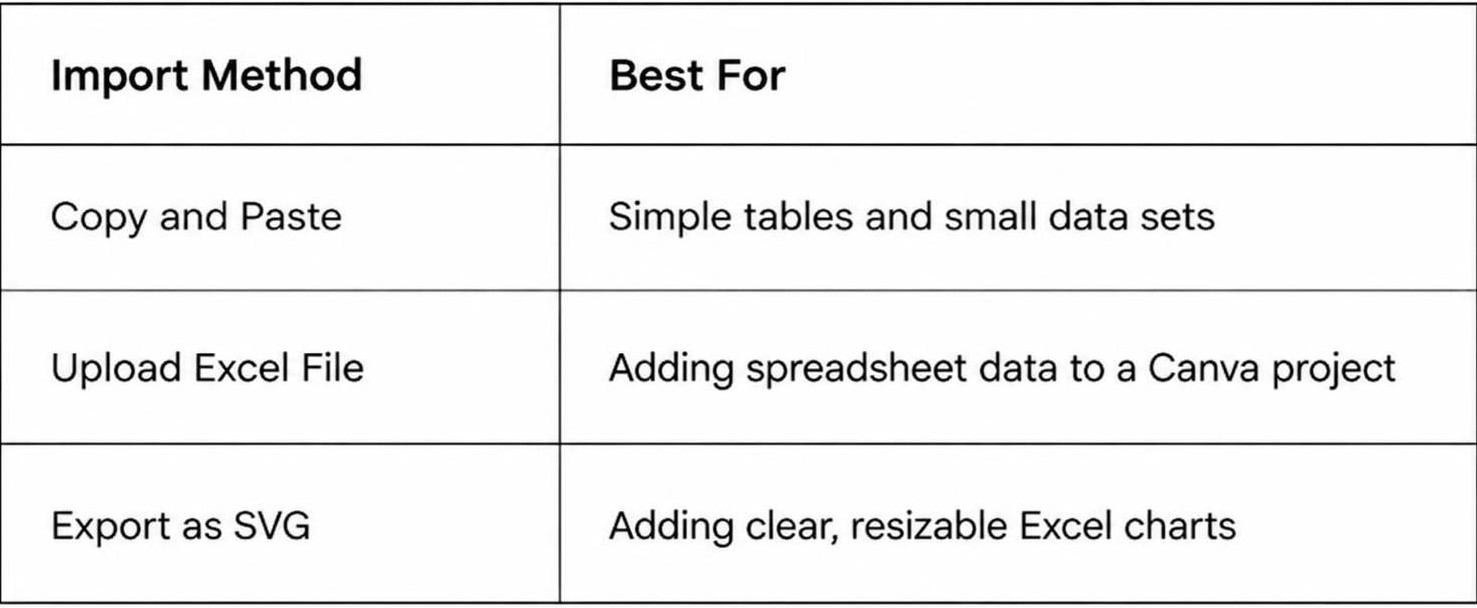
Choose a method based on your presentation needs. For editable data, use a method that lets you update the content. For charts that need a clean appearance, SVG can be a useful option.
How to Use Canva Bulk Create with Excel Data
Canva Bulk Create helps you make multiple slides from spreadsheet data. You can use it to create product slides, employee profiles, charts, or other designs with repeated layouts. Each slide uses different data from your spreadsheet. This saves time compared to editing every slide by hand.
The process starts with a well-organized Excel file. Next, upload the data to Canva and connect each column to the right design element. Follow these steps to create multiple slides from one spreadsheet.
How to Prepare Your Excel Spreadsheet
Start by opening your Excel file. Arrange your data in a clear table. Each column should have a heading. Each row should contain one set of information.
For example, a product presentation may include columns for product name, price, category, and description. Each row can hold details for one product.
Keep these points in mind while preparing your spreadsheet:
- Add clear headings to the first row.
- Keep each type of data in a separate column.
- Place one record in each row.
- Remove empty rows and columns.
- Check spelling and number formats.
- Save the file in XLSX or CSV format.
A clean spreadsheet makes it easier to match your data with Canva elements. Check the file before uploading it.
How to Upload Excel Data to Canva Bulk Create
After preparing your spreadsheet, open Canva and create a new presentation. Choose a template or start with a blank design. Open the Apps section from the editor and search for Bulk Create.
Follow these steps:
- Open your presentation in Canva.
- Select Apps from the editor.
- Search for Bulk Create.
- Open the Bulk Create app.
- Select the option to upload your data.
- Choose your prepared Excel or CSV file.
- Wait for Canva to load the spreadsheet data.
Your uploaded data should appear as a list of fields. Each field represents a column from your spreadsheet. Check the field names before moving to the next step.
How to Connect Spreadsheet Data to Canva Elements
Your spreadsheet data needs to connect with the right elements in your presentation. These elements can include text boxes, images, and other design items.
Start by adding the required elements to your slide. Add a text box for the product name, another for the price, and another for the description.
Follow these steps to connect your data:
- Select the text box you want to use.
- Open the Bulk Create data connection option.
- Choose the matching spreadsheet field.
- Repeat the process for each text box.
- Check that every field connects to the correct element.
For example, connect the Product Name column to the product title text box. Connect the Price column to the price text box. Repeat this process for the other fields. Keep the layout simple and leave enough space for longer text. This helps prevent text from running outside the design area.
How to Generate Multiple Slides from Excel Data
Once all data fields are connected, you can create multiple slides from your spreadsheet. Canva uses each row to fill in the connected design elements.
Follow these steps:
- Review the data connections on your slide.
- Open the Bulk Create panel.
- Select the option to generate your designs.
- Choose the data rows you want to use, if prompted.
- Start the generation process.
- Wait for Canva to create the slides.
Canva will create a separate design for each selected row. Each slide will use the same layout with different spreadsheet data. After generation, review every slide. Check product names, prices, descriptions, and other details. Fix any text that does not fit the layout. Make sure images and other design elements appear in the right places.
How to Edit Excel Tables and Charts in Canva
After importing Excel data into Canva, you can make changes to match your presentation design. Canva lets you adjust table colors, fonts, row sizes, chart labels, and other details. These edits help your data fit the slide layout and make each point easier to read.
How to Customize Table Colors and Fonts
Table colors and fonts can help your data match the rest of your slides. Select the imported table to open its editing options. Choose a font style and size that is easy to read. You can also change the text color and cell background color.
Use your presentation's main colors for table headers. Keep the body cells simple with light backgrounds. Make sure the text has enough contrast against each cell. This helps viewers read the data without extra effort.
How to Adjust Rows and Columns
Some Excel tables may not fit the slide after import. A column may look too narrow, or a row may need more space for its text. Select the table and adjust its rows and columns to improve the layout.
You can make columns wider to show longer labels. Reduce the width of columns with short values. Adjust row heights to prevent text from looking crowded. Keep enough space between the table content and cell edges. This makes the table easier to scan during a presentation.
How to Edit Chart Labels and Data
Imported charts may need a few changes to match your slide. Select the chart to access the available editing options. You can update chart labels, titles, and data values based on the information you want to present.
Use short labels to keep the chart easy to read. Check that each value matches your Excel data. You can also adjust the chart title to explain what the data shows. Clear labels help your audience understand the main point without reading every value.
How to Resize and Position Imported Elements
Imported tables and charts may need size and position changes to fit your slide. Select an element and drag its corner handles to resize it. Use the side handles to adjust its width or height.
Move the element to a suitable place on the slide. Keep enough space around it so the layout does not look crowded. Align tables and charts with nearby text or images. You can also use Canva's alignment tools to keep elements in line.
Check the slide in presentation view after making these changes. Make sure all labels, values, and table text are visible. Adjust the layout again if any part looks too small or falls outside the slide.
How to Convert Excel Data into Canva Presentation Graphics
Excel spreadsheets are useful for storing numbers, lists, and other data. However, large tables can be hard to read on presentation slides. Canva helps turn this information into clear graphics. You can use charts, shapes, icons, and text to present your data in a more visual way. Start by selecting the key information from your Excel sheet. Then, arrange it in Canva to create graphics that fit your presentation.
How to Turn Spreadsheet Data into Infographics
Infographics help explain data through a mix of text, numbers, and visuals. You can use Excel data to create an infographic in Canva.
Start by reviewing your spreadsheet. Pick the figures, percentages, or facts that support your main point. Copy the selected data and add it to your Canva presentation.
Follow these steps:
- Open your Canva presentation and select the slide for your infographic.
- Go to the Elements panel.
- Search for infographic layouts, charts, icons, or shapes.
- Add the elements that match your data.
- Replace the sample text and numbers with your Excel values.
- Adjust the colors, fonts, and layout to match your presentation style.
For example, a sales spreadsheet may contain monthly revenue figures. You can use a set of number cards to show total sales, monthly growth, and the best-performing month. This makes the main figures easier to read.
How to Create Visual Reports from Excel Data
A visual report presents spreadsheet information through charts, tables, and short text blocks. It works well for business updates, sales reports, and project reviews. Start with the main findings in your Excel file. You do not need to include every row or column. Select the data that helps explain the report.
Here is how to build a visual report in Canva:
- Create a new slide in your presentation.
- Add a heading that describes the report.
- Insert a chart, table, or other graphic from the Elements panel.
- Enter the key figures from your Excel spreadsheet.
- Add short labels to explain each section.
- Use a consistent color scheme across the slide.
- Review the layout to make sure the text and figures are easy to read.
You can also split a large report across several slides. Use one slide for sales results, another for customer data, and a third for future targets. This gives each topic enough space.
How to Present Key Figures with Canva Elements
Key figures help your audience understand the main message of a presentation. Canva Elements gives you several ways to display these numbers without using a full spreadsheet table.
For example, you can use large text to highlight revenue, circles to show percentages, or progress bars to compare targets with actual results.
Follow these steps:
- Open the slide where you want to show your key figures.
- Select Elements from the side panel.
- Search for number cards, progress bars, arrows, circles, or other suitable graphics.
- Add your chosen elements to the slide.
- Replace the sample values with figures from your Excel sheet.
- Add short labels to explain what each number represents.
- Adjust the size and position of each element.
Keep the design simple. Use large text for the main numbers and smaller text for supporting details. Avoid adding too many graphics to one slide. Your audience should be able to understand the key figures at a glance.
Live Data and Excel Integration in Canva
Excel data often changes over time. Sales figures, budgets, reports, and other records may need regular updates. This raises a common question: Can Canva keep imported Excel data up to date automatically?
Canva lets users work with uploaded spreadsheet data. However, an uploaded file does not always stay linked to its original Excel file. You may need to upload the latest version to keep your presentation accurate.
Can Canva Automatically Update Excel Data?
Canva does not automatically sync every uploaded Excel file with its original spreadsheet. Once you upload an Excel file, Canva uses the uploaded version. Changes made to the original Excel file do not appear in Canva automatically.
For example, a sales report may show monthly revenue figures. You update the numbers in Excel after each month. The old figures in your Canva presentation will remain unchanged.
To show the latest figures, update the Excel file and upload the revised version to Canva. You can then replace the old table or chart with the new data.
Working with External Spreadsheet Integrations
External spreadsheet tools can help you move data into Canva. They can also make it easier to manage records across different platforms. You can use spreadsheet integrations to prepare data before adding it to your presentation. Some tools also support data sharing and automated workflows.
Here are a few ways to work with external spreadsheet data:
- Prepare data in Excel: Organize your rows, columns, labels, and values before importing the file into Canva.
- Use Google Sheets: Upload or transfer your Excel data to Google Sheets. You can then use the available Canva features to bring that data into your design.
- Use third-party automation tools: Some automation platforms can move spreadsheet data between connected apps. Check their Canva support before setting up a workflow.
- Keep a source file: Store the original spreadsheet in one place. This makes it easier to track changes and prepare new versions.
These methods can reduce manual work. However, check the available features before relying on automatic data transfers.
How to Manage Updated Spreadsheet Data
Updated spreadsheet data needs careful handling. Old figures can affect your charts, reports, and other presentation content. A simple update process can help you keep everything accurate.
Follow these steps to manage your spreadsheet updates:
- Update the original Excel file: Make all changes in your source spreadsheet first. Check the figures and labels before saving.
- Save a new version: Keep a separate copy of the updated file. Use a clear file name so you can tell the latest version from older copies.
- Upload the revised file: Open your Canva project and upload the new Excel file.
- Replace old data: Remove outdated tables or charts. Add the updated elements to the right slides.
- Check the layout: Review the text, colors, labels, and chart sizes. Make sure the new data fits the slide.
- Review every figure: Compare the presentation with the source Excel file. This helps you catch missing values or incorrect numbers.
A regular update process helps keep your Canva presentations accurate. It also makes future edits easier, especially for reports that use new spreadsheet data each month.
How to Maintain Excel Formatting in Canva
Excel tables often contain custom fonts, colors, borders, and cell layouts. These details help readers understand the data. However, some formatting may change after you import Excel content into Canva. You may notice shifted columns, missing borders, or different font styles.
A few simple adjustments can help keep your tables clean and easy to read. Check the layout, text styles, and spacing after importing your Excel data.
Preserve Table Layouts and Cell Formatting
A clear table layout helps readers follow the data. Excel lets you set row heights, column widths, cell sizes, and text positions. Some of these settings may change after you add the table to Canva.
Start by checking the table structure in Canva. Make sure each column has enough space for its content. Adjust the row heights to prevent text from being cut off. Keep related data in the same rows and columns.
Pay attention to cell formatting as well. Check number formats, text wrapping, and merged cells. You may need to resize or edit some cells to match the original Excel layout.
Keep Fonts, Colors, and Borders Consistent
Fonts and colors help separate different types of information. A header row may use bold text, while the remaining cells use a regular font. Keep these styles consistent across your Canva presentation.
Check the imported text for font changes. Apply a similar font from Canva's text options. You can also adjust the font size to make the content easier to read.
Colors and borders need attention too. Follow these steps:
- Select the table or cell you want to edit.
- Open the color settings in Canva.
- Apply the same header and cell colors used in Excel.
- Adjust the border color and thickness.
- Use bold text for column headings.
Keep the color palette simple. Use clear borders to separate rows and columns. This helps the audience read the table without taking attention away from the main message.
Fix Alignment and Spacing Issues
Text alignment can change during the import process. Some values may appear too close to the cell edges. Other text may look uneven across rows.
Check the horizontal and vertical alignment of each cell. Place headings in a consistent position. Keep numbers aligned in the same direction. Left alignment often works well for text. Right alignment can help readers compare numbers.
Spacing also affects how the table looks on a slide. Adjust the column widths to give longer text enough room. Increase row heights to prevent text from touching the borders. Leave enough space around the table so it does not feel crowded.
Finally, review the table in presentation view. Check that all text is readable and that no content extends beyond the slide edges. A clean layout helps your Excel data fit naturally into your Canva presentation.
Common Problems When Importing Excel Data into Canva
Importing Excel data into Canva may not always go as planned. You may face upload errors, missing values, blurry charts, or changes in table styles. These issues can affect your slide layout and make your data harder to read. The good news is that most of these problems have simple fixes. Here are some common issues and ways to handle them.
Excel Files Not Uploading
An Excel file may fail to upload to Canva for several reasons. The file may be too large, damaged, or saved in an unsupported format. A poor internet connection can also stop the upload.
Start by checking the file format. Save your spreadsheet as an XLSX or CSV file. Then try uploading it again. You can also close and reopen Canva before trying again.
If the file is still not uploading, try these steps:
- Check your internet connection.
- Rename the file with a short and simple name.
- Remove extra sheets or unused data.
- Save a fresh copy of the Excel file.
- Try uploading the new copy to Canva.
Missing or Incorrect Spreadsheet Data
Some spreadsheet values may not appear after you upload an Excel file to Canva. You may also notice that numbers, text, or formulas look different from the original sheet.
Start by opening the Excel file. Check that the cells contain the correct values. Remove empty rows and columns that may affect the data range. Make sure the first row has clear column names.
Pay close attention to formulas. Some imported data may show the formula result instead of the formula itself. Copy the final values into a new sheet before uploading. This can help keep your data consistent.
Charts Losing Quality After Import
Excel charts may look blurry or lose detail after you add them to Canva. This can happen due to image compression or a low-resolution export. Small labels and chart lines may also become hard to read.
A better option is to export the chart as an SVG file. This format helps keep lines and text sharp at different sizes. You can then upload the SVG file to Canva.
For charts that need further editing, use a high-resolution PNG file. Avoid stretching the chart too much after uploading. Keep the original proportions to prevent distortion.
Formatting Changes in Imported Tables
An Excel table may look different after you add it to Canva. Font styles, cell colors, borders, and column widths may not match the original spreadsheet. Some text may also appear too large or too small.
You can fix these changes by editing the table in Canva. Select the table and adjust its font, colors, borders, and cell sizes. Check the row height and column width. Make sure all text fits inside each cell.
For a cleaner result, use a simple table style in Excel before uploading. Keep the font size consistent and use a small color palette. This makes it easier to match the table with your presentation design.
Tips for Presenting Excel Data Effectively in Canva
Excel data can contain many rows, columns, and figures. Adding all of it to a Canva presentation may make your slides hard to read. A few simple changes can help you present the data in a clear way.
1. Keep Tables Simple: Show only the rows and columns that support your main point. Remove extra data that your audience does not need. Use clear headings to help readers follow each column.
2. Use Charts to Show Trends: Charts can make large sets of numbers easier to read. Use bar charts to compare values. Choose line charts to show changes over time. Use pie charts to show parts of a whole.
3. Choose Readable Fonts: Use fonts that are easy to read on a large screen. Keep table text large enough for your audience. Avoid using too many font styles on one slide.
4. Apply Consistent Colors: Use the same color scheme across your slides. Highlight key figures with one or two accent colors. Make sure the text stands out from the background.
5. Add Clear Labels: Give each chart and table a short title. Add labels to explain values, units, and categories. This helps your audience understand the data without extra explanation.
6. Leave Enough Space: Avoid placing too many tables and charts on one slide. Add space between elements. Use separate slides for different data sets.
7. Check Your Data Before Presenting: Review all figures, labels, and chart values after importing them into Canva. Make sure nothing is missing or out of place. Update any data that has changed in your Excel file.
A clean slide helps your audience focus on the message. Keep each slide centered on one main point. Use charts and tables only to support that point.
Canva vs. PowerPoint for Working with Excel Data
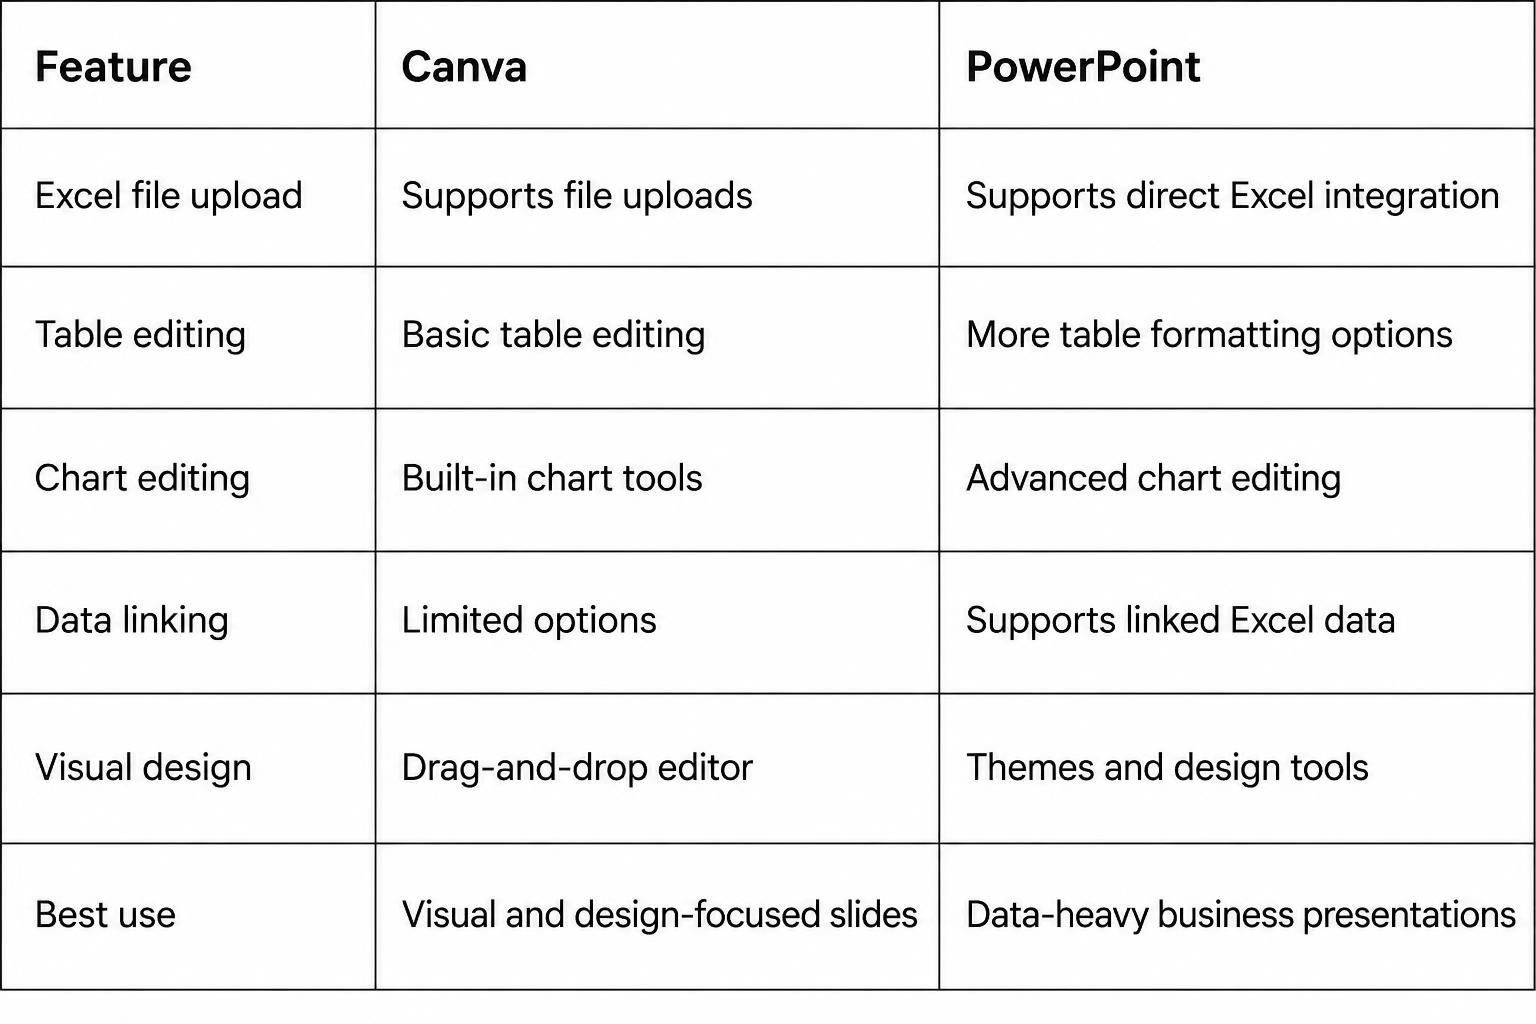
Canva and PowerPoint both let you add Excel data to presentations. However, they offer different ways to work with tables, charts, and other visual elements.
Canva is a good choice for users who want to create slides with a simple visual editor. You can upload Excel files, add charts, adjust colors, and arrange data on your slides. Its drag-and-drop tools make it easy to change the layout and style.
PowerPoint offers more options for working with Excel data. You can copy tables and charts from Excel. You can also link data between Excel and PowerPoint. This helps keep your presentation updated after changes to the source file. PowerPoint also supports embedded Excel worksheets for more detailed data work.
Which Tool Should You Choose?
Choose Canva for presentations that need clean layouts, simple charts, and visual elements. It works well for reports, class projects, and business updates. PowerPoint is a better choice for presentations that need linked Excel data, detailed charts, or frequent data updates. Its connection with Excel gives you more control over your data. Your choice depends on the type of presentation you need. Both tools can help you turn Excel data into slides that are easy to follow.
Final Notes
Importing Excel data into Canva presentations gives you several ways to present tables, charts, and spreadsheet figures. You can copy and paste data, upload Excel files, or export charts as SVG files. Canva Bulk Create also helps you generate multiple slides from one spreadsheet.
Take time to check your imported content. Adjust fonts, colors, borders, and spacing to match your slide design. Review all figures and chart labels to make sure they match the original Excel file. For regular reports, keep an updated copy of your source spreadsheet. Choose the import method that fits your needs. Use Canva for visual reports and simple data graphics. Choose PowerPoint for advanced Excel editing and linked spreadsheet data.
FAQs
1. Can you import Excel data directly into Canva?
Yes. You can upload an Excel file to Canva. You can also copy and paste tables or charts into your presentation. Some content may need extra editing after import.
2. How do I insert an Excel table into Canva?
Copy the cells from your Excel worksheet. Open your Canva presentation and add a table from the Elements panel. Paste the copied data into the table cells. Adjust the font, colors, and column sizes as needed.
3. Can I import Excel charts into Canva?
Yes. Copy a chart from Excel and paste it into your Canva slide. You can also export the chart as an SVG file and upload it to Canva.
4. Can Canva automatically update Excel data?
No. Canva does not automatically sync every uploaded Excel file with its original spreadsheet. You need to upload the revised file and replace the old data manually.
5. How do I use Excel data with Canva Bulk Create?
Prepare your Excel spreadsheet with clear column headings and organized rows. Open Bulk Create in Canva and upload your Excel or CSV file. Connect each spreadsheet field to the right design element. Then generate multiple slides using your data.
6. How do I keep Excel charts clear in Canva?
Export your Excel charts as SVG files before uploading them to Canva. SVG files keep chart lines and labels clear at different sizes. Avoid stretching charts beyond their original proportions.
7. Can I edit Excel tables after importing them into Canva?
Yes. You can adjust table fonts, colors, borders, row heights, and column widths. Some imported content may need to be recreated as a Canva table for full editing control.
8. Is Canva better than PowerPoint for Excel data presentations?
Canva works well for visual presentations with simple tables, charts, and graphics. PowerPoint offers more options for advanced Excel editing, embedded worksheets, and linked spreadsheet data. Choose based on your presentation needs.





You may also be interested in ...

How To Create An Eye-Catching Portfolio
If you’re looking to create an eye-catching portfolio, this post will come in handy. In this article, you can find the easies...
23 Jun, 2024

How To Easily Create An Infographic
Infographics are the perfect way to make a presentation that will impact an audience, but their design and composition might...
08 Jun, 2024

PowerPoint Template Tips & Tricks You Ne...
PowerPoint seems to be an unknown world for many people, especially those who have been assigned to create a presentation out...
08 Jun, 2024