ESG Strategy and Sustainability Report Presentation
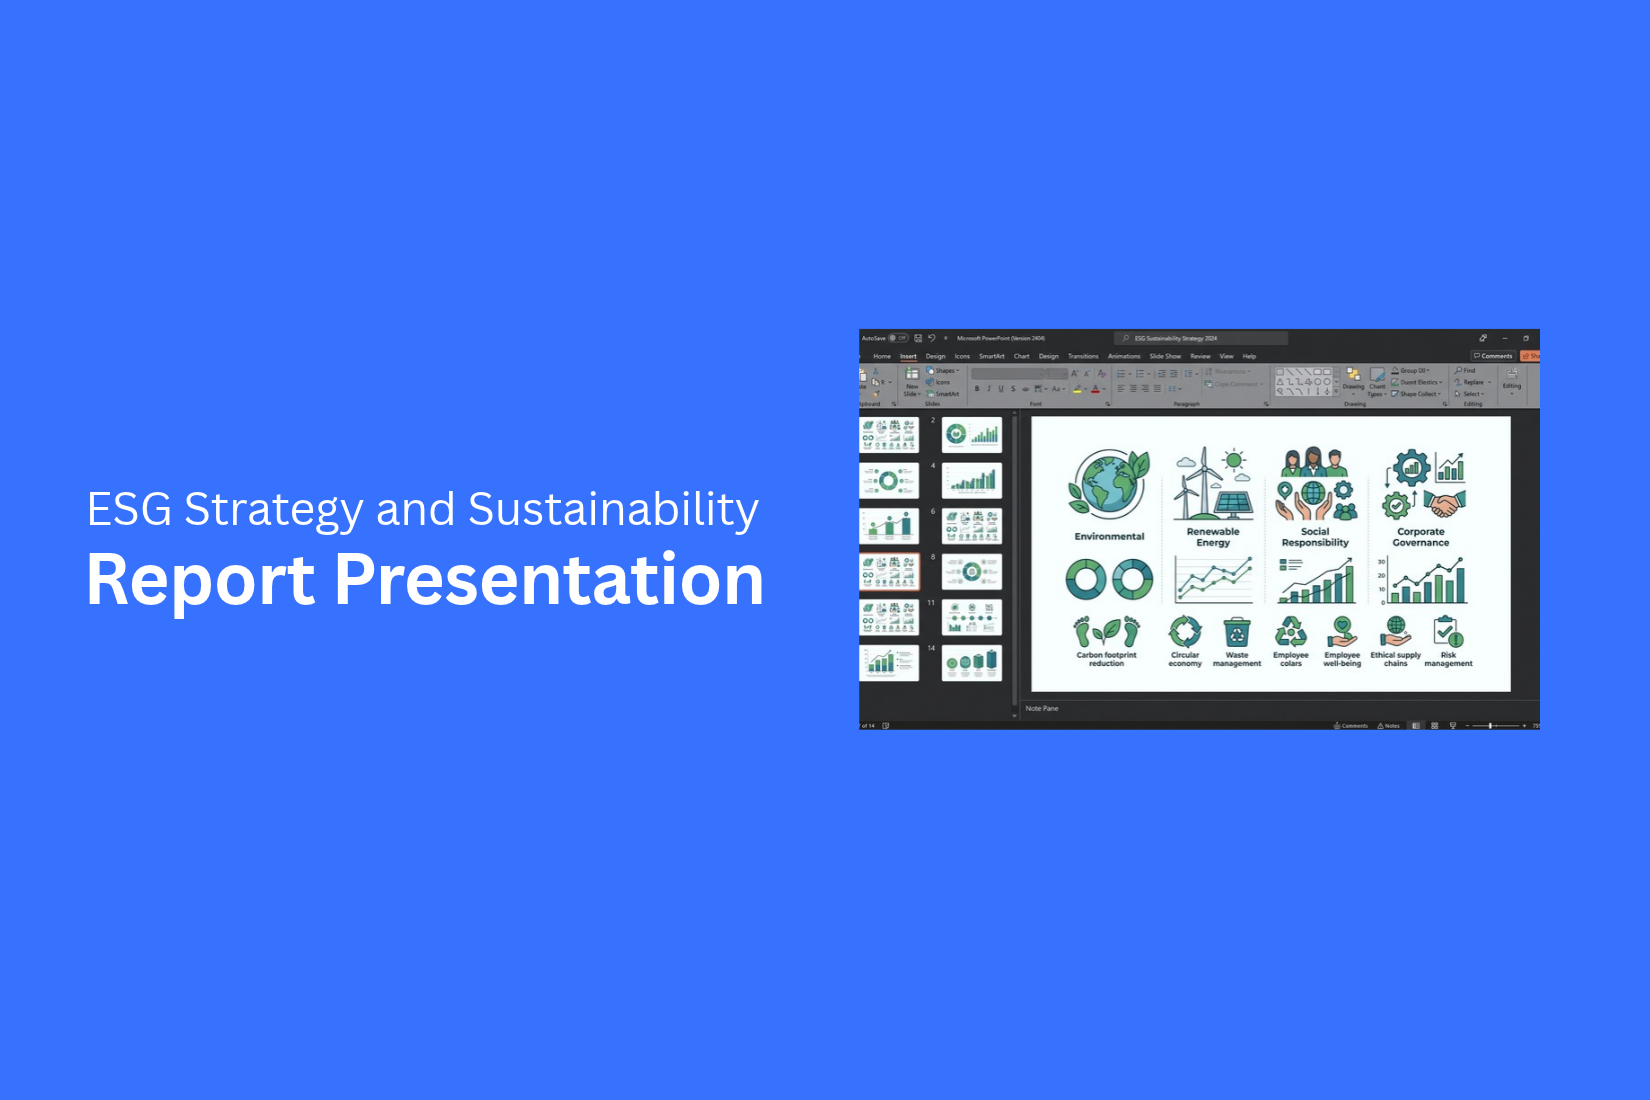
ESG reports bring together data about environmental goals, social responsibility, and governance practices. Presenting all this information in a clear way can be hard. Too much data can make key results difficult to follow and compare.
A strong presentation gives each part of the report a clear place. It helps readers see ESG goals, track progress, review performance, and understand key sustainability efforts. Missed targets and data gaps also need clear explanations.
A well-structured ESG strategy and sustainability report presentation brings these details into one clear story. Charts, tables, metrics, and visuals can make the data easier to read. This guide covers the key sections, slide structure, data presentation methods, and design tips.
What Is an ESG Strategy and Sustainability Report Presentation?
An ESG Strategy and Sustainability Report Presentation explains how a company handles environmental, social, and governance goals. It brings key ESG plans, actions, and results into one presentation.
The presentation can show a company’s goals and progress in areas such as environmental impact, social responsibility, and business governance. It can also help teams share data, plans, and results with clients, leaders, investors, or other stakeholders.
A clear ESG presentation makes key information easier to follow. Charts, tables, timelines, and other visual elements can help show progress and key results. The content can also help teams explain their ESG plans and report updates in a clear format.
Key Elements of an ESG Strategy Presentation
An ESG strategy presentation shows how a company handles environmental, social, and governance topics. It should connect ESG goals with business plans and results. Each part should give the audience clear facts about the company’s actions and progress.
Environmental Goals and Performance
This section covers the company’s impact on the environment. It can include goals for reducing emissions, cutting waste, saving energy, or using resources more carefully.
Show key targets and current results in a simple format. Charts, figures, and short progress updates can help the audience see changes over time. You can also include the steps the company plans to take to reach its environmental goals.
Social Responsibility and Impact
Social responsibility focuses on people and communities. This part can cover employee well-being, workplace safety, diversity, training, human rights, and community programs.
Use clear data to show the results of these efforts. Employee numbers, training hours, safety data, and community projects can give the audience a better view of social impact. Short examples can also show how these efforts affect employees and communities.
Governance and Business Practices
Governance explains how the company is managed and how key decisions are made. Topics may include board structure, ethics, risk management, data privacy, compliance, and reporting practices. Keep this section focused on policies, processes, and measurable results. A simple governance structure can help the audience understand roles and responsibilities. Key policies and oversight methods can also show how the company manages business risks.
ESG Strategy and Business Priorities
An ESG strategy should connect with the company’s main business priorities. This section shows how ESG goals support areas such as growth, risk management, operations, employee needs, and long-term planning.
Present the connection in a clear way. A table can match each ESG goal with a business priority, key action, and measure of progress. This gives the audience a direct view of how ESG fits into the broader business plan.
How to Structure an ESG Sustainability Report Presentation
A clear ESG presentation helps readers follow the main points with ease. Each section should have a clear purpose. Start with the main message, then show goals, results, key actions, and future plans.
Start With an Executive Summary
Open the presentation with a short overview of the ESG report. Share the main results, key goals, and major areas of focus. Keep this section easy to scan. Use a few key points instead of long blocks of text.
The executive summary gives the audience a clear starting point. It also sets the direction for the rest of the presentation.
Present ESG Goals and Priorities
Next, show the ESG goals and priorities. Group them into environmental, social, and governance areas. Give each goal a clear name.
Add key targets or focus areas under each goal. This helps the audience see what the organization plans to improve and track.
Show ESG Performance and Progress
Use this section to show results. Present key ESG data, progress against goals, and major changes over the report period.
Charts and simple tables can make the data easier to read. Keep each visual focused on one main point. Add short notes to explain the numbers.
Explain Key Sustainability Initiatives
Show the actions behind the ESG results. Cover major sustainability programs and other key efforts. Explain what each initiative does and how it supports the ESG goals.
Use short descriptions, data points, or visuals to give each initiative context. This keeps the section clear and focused.
Present Future Goals and Actions
End with the next set of ESG goals and planned actions. Show the areas that need more work and the steps planned for the next report period.
Include clear targets and time frames where available. This gives the audience a simple view of what comes next.
How to Present ESG Metrics and Data
Clear ESG data helps your audience understand how a company is doing across key areas. Use simple charts, short labels, and clear numbers. Keep each slide focused on one main message. This makes the ESG strategy and sustainability report easier to follow.
Show Environmental Performance
Use data that shows the company’s environmental results. You can present figures for energy use, emissions, waste, water use, or other tracked areas. Charts can help show changes over time.
Add a short label to each chart. State the period covered and the unit used. This gives the audience enough context to read the data correctly.
Present Social Metrics
Social metrics show how the company performs in areas related to people. You can use data on employees, workplace practices, training, diversity, or community programs.
Group related metrics on the same slide. Use large numbers for key results and short text for details. This keeps the slide easy to read.
Highlight Governance Metrics
Governance metrics can cover areas such as board structure, ethics, risk controls, and company policies. Use a clear layout to separate each metric. Charts work well for numbers and trends. Short text works better for policies or actions. Keep the focus on measurable results and clear facts.
Compare Targets With Actual Results
A target and actual results view helps show progress. Place the target beside the current result. A bar chart, table, or simple progress graphic can make the comparison clear.
Use the same units and time period for both figures. Add a short note that explains any gap. This gives your audience a clear view of the planned result and the result achieved.
How to Turn ESG Data Into Effective Slides
ESG data can contain many numbers, targets, and updates. A slide should make this data easy to read. Use a clear layout for each type of information. Keep the main point visible and remove details that do not support it.
Use Charts for Performance Trends
Charts help show changes over time. Use line charts for trends such as emissions, energy use, or waste levels. Bar charts work well for comparing ESG results across years, teams, or business areas.
Add clear labels to each chart. Use a short title that tells the reader what the chart shows. Keep the number of data points manageable. Too many lines or bars can make the slide hard to read.
Use Tables for Detailed ESG Data
Tables work well for ESG data that needs exact numbers. You can use them for targets, current results, reporting periods, or key ESG metrics.
Keep the table focused. Use short labels and clear column headings. Highlight the most useful numbers so readers can find them quickly. Avoid filling the slide with rows that do not support the main message.
Use Visuals for ESG Goals and Initiatives
Visuals can explain ESG goals in a simple way. Use icons, diagrams, or simple graphics to show areas such as energy use, waste reduction, employee programs, or community projects.
Pair each visual with a short label. Keep the design consistent across the presentation. The visual should support the data, not take attention away from it.
Keep Data Easy to Compare
Use the same units, labels, and number formats across related slides. This makes changes easier to spot. Place related metrics close to each other. Use the same chart type for similar data. Keep scales consistent across charts that show the same metric. Clear comparisons help the audience understand progress without reading every number.
How to Present ESG Goals and Sustainability Progress
A clear ESG presentation should show where your organization wants to go and how much progress it has made. Use simple data and direct points. This helps the audience see the link between goals, results, and future plans.
Set Clear ESG Targets
Start with specific ESG targets. Each target should state what the organization plans to improve. Add a clear time frame and a way to track results. For example, a company may set a target to cut energy use by a set amount within a certain period. Clear targets make progress easier to track.
Show Progress Against Goals
Show current results next to each ESG goal. Use charts, tables, or short data points to make the results easy to read. Include the starting point, current result, and target. This gives the audience a clear view of progress over time.
Explain Missed Targets
Some goals may not be reached on time. State the missed target in a clear way. Then explain the main reason behind the gap. Use data to support the explanation. This gives the audience a better view of what happened and what needs to change.
Outline Future Actions
End the section with the next steps. List the actions planned to support each ESG goal. Add clear owners, time frames, and measures where possible. This shows how the organization plans to keep its ESG work moving forward.
ESG Reporting Frameworks to Consider
ESG reporting helps present a clear view of a company’s environmental, social, and governance work. A strong report needs clear data and a clear structure. It should also show how ESG work supports wider business goals.
Understand ESG Reporting Standards
Start by learning the reporting standards that fit your ESG report. Each standard may ask for different types of information. A clear understanding helps your team collect and present the right data.
Review the main areas covered by the selected standard. Check the data needed for each area. This gives your team a clear path for building the report.
Align Data With Reporting Requirements
Your ESG data should match the needs of the selected reporting standard. Keep data organized by topic and reporting area. This makes the report easier to build and review.
Use clear labels for each metric. Keep records consistent across the report. A simple data structure also makes it easier to spot missing information.
Connect ESG Metrics to Business Goals
ESG metrics should have a clear link to business goals. This helps show why each metric matters to the company. Group related metrics with the business goals they support. Use clear numbers and short explanations. This gives readers a better view of how ESG work fits into the wider business plan.
Common ESG Presentation Mistakes
An ESG strategy and sustainability report should make key information easy to follow. Some slide choices can make the report harder to understand. Too much data, unclear metrics, and missing results can weaken the message. A clear structure helps the audience see what the company planned, what it achieved, and where gaps remain.
Adding Too Much Data to One Slide
A slide can lose its purpose if it contains too much data. Large tables and long lists can make key points hard to spot. The audience may miss the main result.
Give each slide one clear purpose. Show the data that supports that point. Keep extra details for other slides or supporting content.
Showing Activities Instead of Results
ESG reports should show more than a list of actions. A company may list programs, projects, or goals without showing what they achieved. This gives the audience little proof of progress.
Use results to show the effect of each major activity. Clear results help connect ESG actions to actual progress.
Using Unclear ESG Metrics
ESG metrics need clear meaning. A number without context can be hard to understand. The audience may not know what the number measures or why it matters.
Use clear metric names and explain what each metric tracks. Keep the format consistent across the presentation. This makes results easier to read and compare.
Hiding Missed Targets or Data Gaps
Not every ESG target will be met. Some data may also be missing or incomplete. Leaving these points out can create an incomplete report.
Show missed targets clearly. State where data is not available. This gives the audience a more complete view of ESG progress and the areas that still need work.
ESG Presentation Design Tips
A clear design helps your audience follow your ESG strategy and sustainability report. Each slide should present one clear idea. Use simple layouts, readable data, and visuals that support your message.
Use a Consistent Slide Layout
Keep the same layout style across the presentation. Use similar title positions, text areas, and spacing on each slide. This gives the report a clean and organized look.
Use the same font styles for headings and body text. Keep chart positions consistent too. A steady layout helps the audience focus on the ESG content instead of the slide design.
Highlight Important ESG Metrics
Give key ESG metrics a clear place on the slide. Use large numbers, short labels, or simple visual elements to draw attention to important results.
Keep each metric easy to understand. Add a short label that explains what the number shows. Group related metrics together so the audience can compare them without searching across the slide.
Keep Charts and Tables Readable
Charts and tables should be easy to read from a distance. Avoid placing too much data on one slide. Use clear labels and enough space between rows, columns, and chart elements.
Show only the data needed for the main point. Break large tables into smaller sections across multiple slides. This keeps the information clear and easier to follow.
Match Visuals With Your ESG Data
Use visuals that support the data on the slide. Photos, icons, diagrams, and simple graphics can help explain an ESG topic.
Choose visuals that connect directly to the message. A sustainability image can support an environmental topic, while a process graphic can explain an ESG strategy. Keep visuals simple so they do not distract from the data.
Benefits of an ESG Strategy and Sustainability Report Presentation
An ESG strategy and sustainability report presentation helps a company share its environmental, social, and governance work in a clear format. It brings key goals, results, and plans into one place. This makes it easier for people to review progress and understand the company’s direction.
Improve Stakeholder Communication
Stakeholders need clear information about a company’s ESG work. A presentation can show key goals, actions, results, and areas that need more work. Simple charts and short points can make the message easier to follow.
It also gives teams a clear way to share the same information with investors, employees, partners, and other stakeholders. This can help keep everyone informed about ESG plans and progress.
Track ESG Performance
An ESG presentation can show how the company is doing against its ESG goals. It can include data on areas such as energy use, emissions, employee programs, or governance measures.
A clear view of past and current results helps teams spot changes over time. It also makes it easier to see which goals are on track and which areas need more attention.
Support Business Decisions
ESG data can give leaders useful information for business planning. A presentation can bring key results, risks, goals, and actions into one view.
This helps teams review ESG factors as part of business discussions. It can also help leaders set priorities and decide where resources should go.
Communicate Long-Term Sustainability Goals
Long-term goals need a clear message. An ESG presentation can show where the company wants to go and the steps planned to get there.
It can include targets, timelines, key actions, and progress updates. This gives stakeholders a simple view of the company’s sustainability plans and how current work supports future goals.
Final Notes
An ESG strategy and sustainability report presentation brings environmental, social, and governance information into one clear format. It can show goals, actions, results, missed targets, and future plans.
A strong presentation keeps each slide focused. Use clear metrics, simple charts, readable tables, and useful visuals. Keep related data together and use the same units and labels across the report.
The presentation should also show both progress and gaps. Clear reporting helps stakeholders understand what the company has achieved and what still needs work. A simple structure makes ESG data easier to review, compare, and discuss.
With the right structure, an ESG presentation can support better communication, performance tracking, business planning, and long-term sustainability goals.
FAQs
What is an ESG strategy and sustainability report presentation?
An ESG strategy and sustainability report presentation shows a company’s environmental, social, and governance goals, actions, results, and future plans in a clear format.
What should an ESG strategy presentation include?
It should include environmental goals, social responsibility, governance practices, ESG strategy, business priorities, key metrics, performance results, and future actions.
How should ESG data be presented in a presentation?
Use simple charts, clear tables, short labels, and key numbers. Keep each slide focused on one main point. Use the same units and formats across related slides.
How do you show ESG progress in a presentation?
Show the starting point, current result, and target. A chart, table, or progress graphic can help the audience see the change over time.
How should missed ESG targets be presented?
Show the missed target clearly. Explain the main reason for the gap and support the explanation with data. Also include the actions planned to address the gap.
What charts work well for ESG presentations?
Line charts can show changes over time. Bar charts can compare results across years, teams, or business areas. Tables work well for exact ESG figures.
How can an ESG presentation avoid too much data?
Give each slide one clear purpose. Show only the data that supports the main point. Move extra details to other slides or supporting content.
Why should ESG metrics connect to business goals?
The connection shows how ESG work supports areas such as growth, risk management, operations, employee needs, and long-term planning.
What are common ESG presentation mistakes?
Common mistakes include adding too much data to one slide, showing activities without results, using unclear metrics, and leaving out missed targets or data gaps.
How can ESG slides be easier to read?
Use a consistent layout, clear labels, readable charts, short text, and enough space between content. Keep visuals connected to the main message.


You may also be interested in ...

Tips To Create A Great Infographic
Infographics Have been around for a while, but not many people know about them or are their preferred presentation choice. If...
08 Jun, 2024

3 Steps To Create The Best Presentation...
Presentations are something wonderful when well done, you can captivate an audience or be super interested in what another pe...
23 Jun, 2024

3 Tips For Your Next Presentation You MU...
PowerPoint presentations are perfect for explaining a topic and communicating your ideas with a visual aid. But most people s...
08 Jun, 2024