How to Create an Interactive Map Using PowerPoint
A basic map can show where places are, but it may not give your audience much to do. Static maps can also make location details hard to follow during a presentation. Your viewers may need to scan several slides to find the place they need.
A clickable map makes the experience easier to follow. Your audience can select a location and move to a slide with more details. This setup also gives you more control over how people move through your presentation.
PowerPoint has several tools for building an interactive map. You can use hyperlinks, shapes, Zoom, and animation triggers. This guide shows how to create an interactive map in PowerPoint. You will also learn how to customize it and fix common problems.
What Is an Interactive Map in PowerPoint?
An interactive map in PowerPoint lets people click parts of a map to see more information. Each area can link to another slide, text box, image, or website. This makes the map more useful than a static image.
For example, a map of the United States can show details for each state. A user can click a state and jump to a slide with facts, charts, or images. You can also add buttons for easy movement between slides.
PowerPoint does not have a special interactive map tool. You can build one by using shapes, hyperlinks, action buttons, and slide links. This gives you control over how the map looks and how people use it during a presentation.
Why Create an Interactive Map in PowerPoint?
An interactive map can make location-based information easier to understand. It lets you show places, regions, routes, or data in a clear visual format. PowerPoint gives you simple tools to build this type of map. You can add shapes, images, links, and buttons to your slides. These elements can help viewers move between locations or see more details.
An interactive map also works well for presentations about travel, sales areas, markets, education, and business plans. It can turn a basic map into a more useful part of your presentation. A map can also keep your audience involved. Viewers can click on parts of the map to view related slides or information. This creates a more active way to present location-based content.
How to Create an Interactive Map Using PowerPoint
PowerPoint lets you turn a basic map into an interactive presentation. You can add clickable areas to a map. Each area can lead to a slide with more details about that place. This setup works well for travel plans, business regions, school projects, sales territories, and location-based reports. The main map acts as a starting point. Each location then leads to its own slide. Here is how to build one from start to finish.
Step 1: Add a Map to Your PowerPoint Slide
Start by opening PowerPoint and creating a new presentation. Use a blank slide for the main map. A blank layout gives you more space for the map and location buttons. Go to Insert > Pictures to add your map. Choose the map file from your computer. You can use a simple image or a map graphic that fits your topic.
Resize the map so it fills most of the slide. Keep the map large enough to read during the slideshow. Avoid making it so large that key locations sit outside the slide area. You can also add a title above the map. Use a clear title such as Sales Regions, Travel Map, or Project Locations. Keep the first slide simple. This slide will work as the main navigation screen.
Step 2: Add Clickable Locations to the Map
Your map needs clear areas that users can click. PowerPoint shapes work well for this task. Go to Insert > Shapes. Pick a simple shape, such as a circle or rounded rectangle. Place it over the first location on your map. Make the shape large enough to click. Do not cover too much of the map. A small marker can work well for a single city. A larger shape may work better for a region.
Add a short label to each marker. For example, you can use a city name, region name, or number. Create markers for all the locations you want to include. Keep the marker style the same across the map. This helps users understand that each marker has the same function. You can also use icons as location markers. A pin icon can work well for travel maps. Simple shapes may be easier to edit and link. The key goal is clear navigation. Users should know which parts of the map they can click.
Step 3: Create Slides for Each Location
Each clickable location needs a slide. Create a separate slide for every place on your map. Start with the first location. Add its name as the slide title. Then add the information you want users to see.
You can include:
• Photos of the location
• A short description
• Key facts
• Sales data
• Travel details
• Charts
• Maps or diagrams
• Links to related content
Keep the information focused. Users should quickly understand why the location matters. Use the same basic layout for each location slide. For example, place the location name at the top. Put the main image on one side. Add facts or text on the other side.
This makes the map feel like one connected presentation. It also makes the slides easier to scan. Add all location slides before creating the links. This gives you a complete set of destinations for your map buttons.
Step 4: Link Map Locations to Other Slides
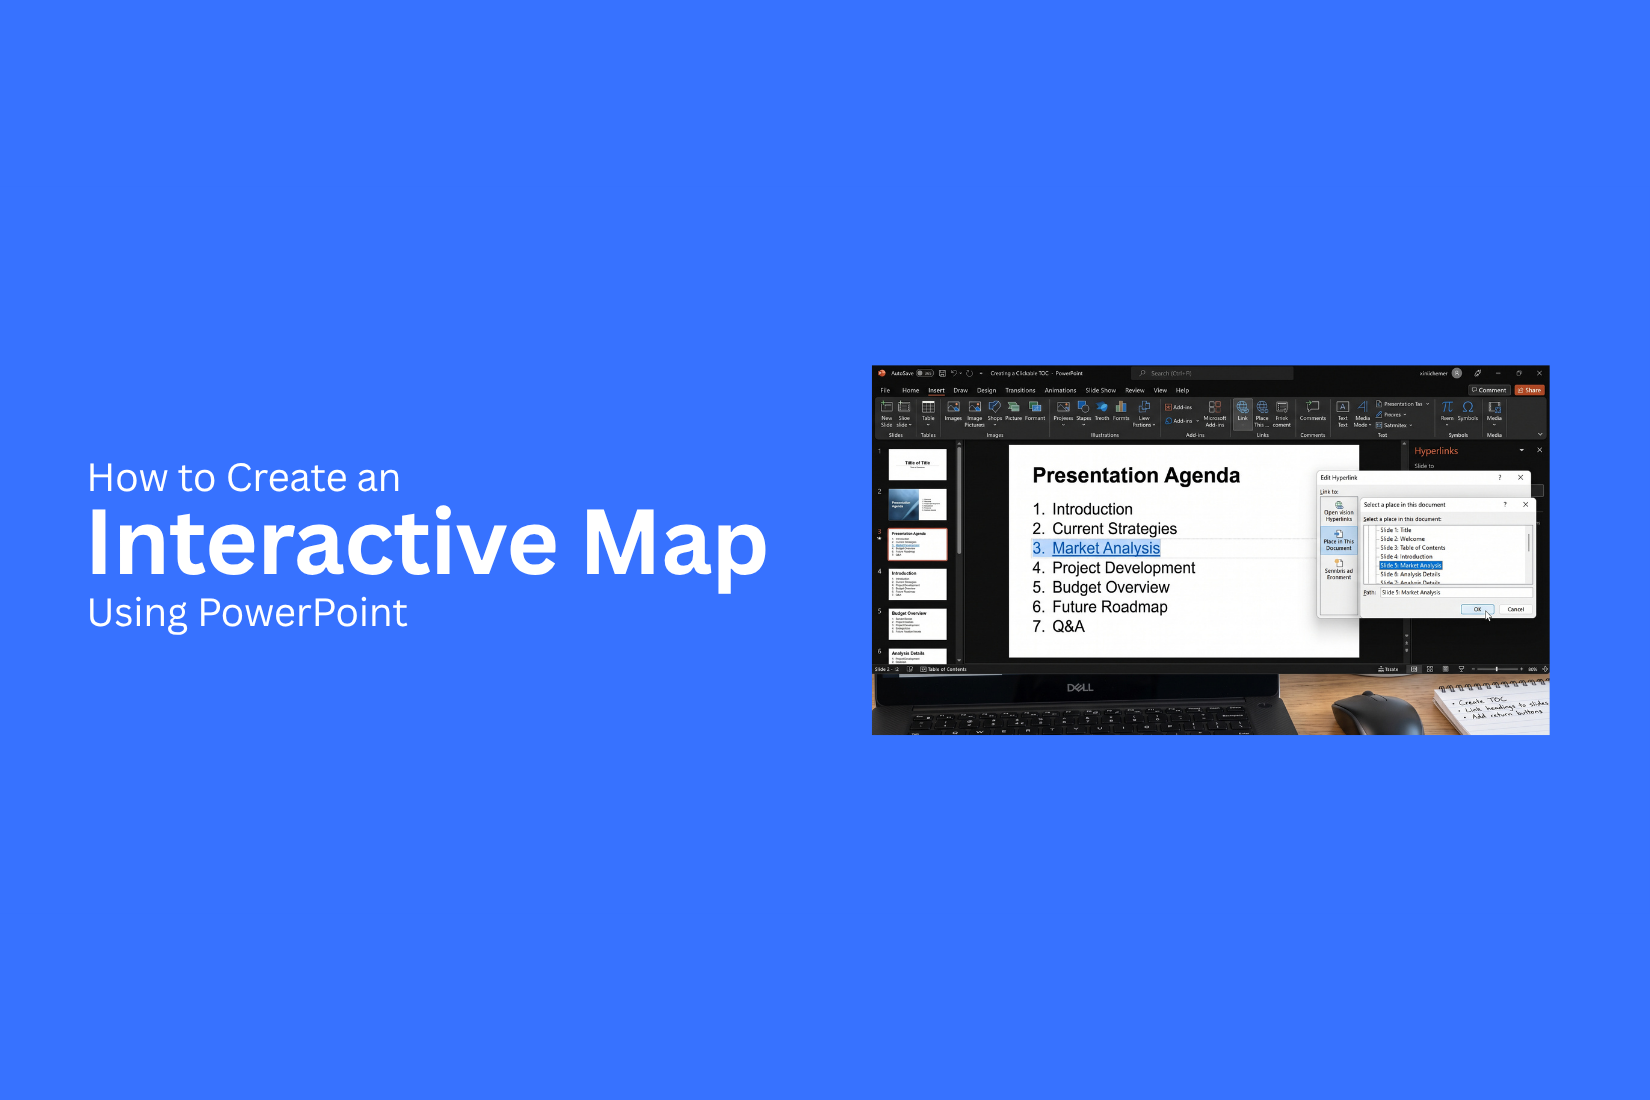
Now connect each map marker to its matching slide. This is what makes the map interactive. Return to the main map slide. Select the shape or marker for the first location. Go to Insert > Link. In the link options, choose Place in This Document. You will see the slides in your presentation. Select the slide that belongs to that location. Then click OK.
Repeat these steps for every marker on the map. Check each link as you create it. A wrong slide selection can send users to the wrong location. You can also add links to text or other shapes. This gives you more options for creating navigation buttons. Keep the navigation simple. Each marker should lead to the slide that matches its location. This creates a clear path for the user.
Step 5: Add a Home or Back Button
Users need an easy way to return to the main map. A Home or Back button solves this problem.
Open one of your location slides. Go to Insert > Shapes and choose a simple shape for the button.
Add text such as Home, Back to Map, or Map. Place the button in the same spot on each location slide. The bottom corner often works well. Next, select the button. Go to Insert > Link. Choose Place in This Document. Select the main map slide.
Click OK to add the link.
Copy the button to the other location slides. This saves time and keeps the navigation consistent. You can also add a small home icon instead of text. Add a text label if the icon may not be clear to every viewer. The button should be easy to find. Avoid placing it over important content or near other clickable items.
Step 6: Test Your Interactive Map
Testing helps you find problems before you present. Start the slideshow from the beginning. Click each location marker on the map. Check that it opens the correct location slide. Visit every location at least once. Next, test the Home or Back button on every location slide. Make sure it returns to the main map.
Pay attention to these details:
• Does every marker work?
• Does each marker open the right slide?
• Can users return to the main map?
• Are the buttons easy to click?
• Are the labels easy to read?
• Do any links open the wrong slide?
• Does the map look clear in slideshow mode?
Test the presentation from the user's point of view. Click through the map in a natural order. This can reveal confusing navigation that may not be clear during editing. Also check the presentation on the screen you plan to use. Small markers may look clear on your computer but become hard to click during a presentation. Fix any broken or confusing links before sharing the file. A final test gives you a smoother interactive map experience.
How to Create an Interactive Map Using PowerPoint Shapes
PowerPoint shapes can turn a map into an interactive slide. You can edit each shape, change its color, and add links. This gives you more control over the map design.
Add an Editable Map
Start with a map that you can edit in PowerPoint. Use a map made from separate shapes for each region.
- Open your PowerPoint presentation.
- Add a map made with editable shapes.
- Select the map.
- Right-click a region to edit its shape.
- Change the fill color or outline as needed.
- Resize or move regions to fit your slide.
Each region should work as its own shape. This makes it easier to edit and control each part of the map.
Highlight Individual Regions
Use different fill colors to draw attention to specific regions. A darker shade can mark the selected area. Keep other regions in a lighter shade. You can also add an outline to a region. This helps separate it from nearby areas. Select a region and open the Shape Format tab. Use Shape Fill to change its color. Use Shape Outline to adjust the border. This setup works well for maps that show sales areas, office locations, travel routes, or other location-based data.
Add Links to Map Regions
Links can make each map region clickable. A viewer can select a region and open another slide or web page. Select the shape for the region. Go to Insert > Link. Choose the slide or web page you want to open. Then select OK. Repeat these steps for other regions. Each shape can point to a different slide or page. A map can now act as a simple navigation menu. For example, a map of the United States can link each state to a slide with more details. This keeps the main slide clean and lets viewers choose the area they want to view.
How to Create an Interactive Map With PowerPoint Zoom
PowerPoint Zoom can turn a map into an interactive slide. You can link map areas to other slides in your presentation. This lets viewers move from the main map to a specific location.
Add Slide Zoom
Start with a map on your main slide. Then add the slides that show each location in more detail.
- Open the Insert tab.
- Select Zoom.
- Choose Slide Zoom.
- Select the slides you want to link to the map.
- Click Insert.
PowerPoint adds a thumbnail for each selected slide. Each thumbnail works as a clickable link.
Position Zoom Over Map Locations
Move each Zoom thumbnail to the right spot on your map. Place it over the area that matches the linked slide. Resize each thumbnail to fit the map. Keep the map easy to read. Avoid covering key labels or details. You can also use small Zoom thumbnails for busy maps. This keeps the layout clean and gives each location a clear clickable area.
Customize the Zoom Effect
PowerPoint gives you options to change how the Zoom works. Select a Zoom thumbnail to access the Zoom tab. Use Zoom Styles to change its look. You can also turn on Zoom Transition for a smooth move into the linked slide. The Return to Zoom option can bring viewers back to the main map after they view a linked slide. This makes it easy to visit several locations from one map.
How to Add Interactive Effects to a PowerPoint Map
An interactive map can make your PowerPoint easier to use. You can add effects that respond to clicks. This lets you show more details without placing all the content on one slide.
Use Animation Triggers
Animation triggers let an object start an effect after you click another object. They work well for map points, labels, and icons. For example, add a small circle to a location on your map. Add an animation to a text box with details about that location. Set the text box animation to start after you click the circle. This keeps the slide clean. Your audience sees the details only after you select the location.
Highlight a Location When Clicked
You can make a map location stand out after a click. Use a shape, icon, or text box to mark the area. Add an entrance or emphasis animation to the marker. Then set the animation to use a trigger. Select the map marker as the trigger object. Now, clicking the marker starts the effect. The location can grow, change size, or show a label. This gives your map a clear visual response.
Add Navigation Buttons
Navigation buttons help users move between map sections. Add simple shapes to act as buttons. Use labels such as Next, Back, or Home. You can link each button to another slide. Select the shape, open the link options, and choose the slide you want to open. This setup works well for maps with several regions. Users can move through the map without leaving the presentation flow.
How to Make a Map Clickable in PowerPoint
A clickable map lets viewers select a location and move to related content. PowerPoint can do this with links and slide actions.
- Select the map shape or location marker.
- Go to Insert > Link.
- Choose Place in This Document.
- Select the slide you want to open.
- Click OK.
- Repeat these steps for each location.
You can also use Action settings. Select the map item, then go to Insert > Action. Choose Hyperlink to and pick the target slide. For a clean setup, create one slide for each location. Add details, images, charts, or notes to each slide. Add a Back to Map button on every detail slide. Link that button to the main map slide.
How to Customize Your Interactive PowerPoint Map
A clear design helps people use your map with less effort. Keep the map simple. Use colors, markers, labels, and icons with a clear purpose.
Change Map Colors
Use colors to separate areas or show different data points. Select a map shape and open the Shape Fill menu. Pick a color that fits your presentation. Use a small color set across the map. Keep text easy to read. Avoid using too many bright colors.
Customize Location Markers
Markers help people spot clickable areas. Use circles, pins, dots, or other simple shapes. Place each marker close to its location. Keep marker sizes similar. Use one marker style for the same type of location. You can also use a different color for selected or featured locations. Link each marker to the slide that contains its related content.
Add Labels and Icons
Labels make locations easier to identify. Add short names near each marker. Keep the text brief. Icons can add quick visual clues. A school icon can mark a school. A store icon can mark a store. Use simple icons that match the map style.
Use Consistent Visual Styles
Keep the same fonts, colors, marker shapes, and icon styles across the map. This makes the map easier to follow. Use the same button style for navigation. Keep labels aligned. Give each slide a similar layout. A simple visual system also makes updates easier. You can change one style and apply it across the map.
Tips for Creating an Effective Interactive Map
A good interactive map should be easy to use. Keep the design clean and the controls clear. Use a simple map that fits your topic. Too many details can make the map hard to read.
Use these tips:
• Keep labels short: Use simple names for places.
• Use clear links: Make buttons and map areas easy to spot.
• Keep the layout clean: Leave enough space between clickable areas.
• Use the same style: Keep buttons, fonts, and shapes consistent.
• Add clear navigation: Give users an easy way to move back and forth.
• Test every link: Open Slide Show mode and test each clickable area.
• Guide the viewer: Use short labels or instructions near the map.
• Limit extra elements: Add only items that help the viewer use the map.
A simple layout helps users focus on the map. It also makes each clickable area easier to find.
Common Problems With Interactive Maps in PowerPoint
Interactive maps can have small issues that affect how people use them. A link may stop working. Two clickable areas may sit too close together. A viewer may also lose track of where to go next. Here are some common problems and simple ways to fix them.
Hyperlinks Do Not Work
A hyperlink may point to the wrong slide or page. It may also be attached to the wrong object. Check the link on each button or map area. Open the Insert tab and review the link settings. Then test the link in Slide Show mode. Test links again after moving or copying objects. This helps catch broken links before you share the file.
Map Locations Are Difficult to Click
Small locations can be hard to select. This often happens with maps that have many nearby places. Use larger shapes over small map areas. Make the shapes transparent or give them a light fill. Then add the hyperlink to the shape. Keep clickable areas separate. This makes each location easier to select.
Interactive Elements Overlap
Buttons, labels, and map areas may overlap. This can cause the wrong link to open. Move objects apart when possible. Use the Selection Pane to find objects that sit on top of each other. You can also use the Bring Forward and Send Backward options to control the object order. A clean layer order makes the map easier to use.
Navigation Becomes Confusing
A map with many links can leave users unsure about their next step. They may not know how to return to the main map. Add a clear Home, Back, or Map button. Keep these buttons in the same place on each slide. Use short labels for each action. A simple navigation system helps users move through the map without guesswork.
Best PowerPoint Templates for Interactive Maps
A ready-made PowerPoint template can save time during the design process. Look for templates with clean maps, editable shapes, and clear layouts.
Good template features include:
• Editable map shapes
• Clickable areas
• Simple navigation buttons
• Space for labels
• Clean slide layouts
• Consistent fonts and shapes
• Easy-to-edit colors
• Multiple map views
Pick a template that matches the purpose of your presentation. A business presentation may need a clean layout. A classroom presentation may need larger labels and simple controls. Check each map area before adding your links. Make sure the shapes are easy to select and edit. A well-built template gives you a solid base for an interactive PowerPoint map.
Tips for Creating an Effective Interactive Map
A good interactive map should be easy to use. Keep the design clean and the controls clear. Use a simple map that fits your topic. Too many details can make the map hard to read.
Use these tips:
• Keep labels short: Use simple names for places.
• Use clear links: Make buttons and map areas easy to spot.
• Keep the layout clean: Leave enough space between clickable areas.
• Use the same style: Keep buttons, fonts, and shapes consistent.
• Add clear navigation: Give users an easy way to move back and forth.
• Test every link: Open Slide Show mode and test each clickable area.
• Guide the viewer: Use short labels or instructions near the map.
• Limit extra elements: Add only items that help the viewer use the map.
A simple layout helps users focus on the map. It also makes each clickable area easier to find.
Common Problems With Interactive Maps in PowerPoint
Interactive maps can have small issues that affect how people use them. A link may stop working. Two clickable areas may sit too close together. A viewer may also lose track of where to go next. Here are some common problems and simple ways to fix them.
Hyperlinks Do Not Work
A hyperlink may point to the wrong slide or page. It may also be attached to the wrong object.
Check the link on each button or map area. Open the Insert tab and review the link settings. Then test the link in Slide Show mode. Test links again after moving or copying objects. This helps catch broken links before you share the file.
Map Locations Are Difficult to Click
Small locations can be hard to select. This often happens with maps that have many nearby places.
Use larger shapes over small map areas. Make the shapes transparent or give them a light fill. Then add the hyperlink to the shape. Keep clickable areas separate. This makes each location easier to select.
Interactive Elements Overlap
Buttons, labels, and map areas may overlap. This can cause the wrong link to open. Move objects apart when possible. Use the Selection Pane to find objects that sit on top of each other. You can also use the Bring Forward and Send Backward options to control the object order. A clean layer order makes the map easier to use.
Navigation Becomes Confusing
A map with many links can leave users unsure about their next step. They may not know how to return to the main map. Add a clear Home, Back, or Map button. Keep these buttons in the same place on each slide. Use short labels for each action. A simple navigation system helps users move through the map without guesswork.
Best PowerPoint Templates for Interactive Maps
A ready-made PowerPoint template can save time during the design process. Look for templates with clean maps, editable shapes, and clear layouts.
Good template features include:
• Editable map shapes
• Clickable areas
• Simple navigation buttons
• Space for labels
• Clean slide layouts
• Consistent fonts and shapes
• Easy-to-edit colors
• Multiple map views
Pick a template that matches the purpose of your presentation. A business presentation may need a clean layout. A classroom presentation may need larger labels and simple controls. Check each map area before adding your links. Make sure the shapes are easy to select and edit. A well-built template gives you a solid base for an interactive PowerPoint map.
Final Notes
An interactive map can make a PowerPoint presentation easier to use. Start with a clear map. Add clickable markers or editable regions. Link each area to a slide with useful details. Add a Home or Back button to keep navigation simple. PowerPoint gives you several ways to build the map. Hyperlinks work well for basic navigation. Shapes give you more control over clickable areas. Zoom can connect map locations to detail slides. Animation triggers can add click-based effects. Take time to test every link in Slide Show mode. Check the marker size, labels, button placement, and slide links. A simple map with clear controls gives your audience an easier way to view location-based content.
FAQs
What is an interactive map in PowerPoint?
An interactive map lets viewers click locations on a map. Each location can open another slide, image, text box, or website.
Can I make a map clickable in PowerPoint?
Yes. You can make a map clickable with hyperlinks, shapes, and Action settings. Each clickable area can link to a specific slide or web page.
How do I link a map location to another slide?
Select the map marker or shape. Go to Insert > Link. Choose Place in This Document. Select the target slide and click OK.
Can I use PowerPoint shapes to make an interactive map?
Yes. You can place shapes over map locations. Each shape can have its own link. Editable map shapes can also let you select and edit each region.
Can PowerPoint Zoom be used for interactive maps?
Yes. Slide Zoom can link map areas to detail slides. You can place each Zoom thumbnail over its matching location on the map.
How do I add a Back to Map button?
Add a shape to a location slide. Add text such as Back to Map. Then link the shape to the main map slide. Copy the button to the other location slides.
Can I add animation to an interactive PowerPoint map?
Yes. Animation triggers can make an effect start after a map marker is clicked. You can use them to show labels, text boxes, or other details.
How do I make small map locations easier to click?
Place a larger transparent or lightly filled shape over the location. Add the hyperlink to that shape. Keep nearby clickable areas separate.
Why are my PowerPoint map links not working?
The link may point to the wrong slide. It may also be attached to the wrong object. Check the link settings and test each link in Slide Show mode.
How do I test an interactive PowerPoint map?
Start the slideshow from the beginning. Click every map location. Check each linked slide. Test every Home or Back button. Also check that labels and clickable areas are easy to use.



You may also be interested in ...

How To Create An Eye-Catching Portfolio
If you’re looking to create an eye-catching portfolio, this post will come in handy. In this article, you can find the easies...
23 Jun, 2024

How To Easily Create An Infographic
Infographics are the perfect way to make a presentation that will impact an audience, but their design and composition might...
08 Jun, 2024

PowerPoint Template Tips & Tricks You Ne...
PowerPoint seems to be an unknown world for many people, especially those who have been assigned to create a presentation out...
08 Jun, 2024