How to Create a Capacity Planning Presentation for Better Decisions.
Capacity planning helps businesses understand how many people, tools, and other resources they need to meet demand. Yet presenting this information can be hard. Too many numbers or unclear charts can make it difficult for teams to see what they have and what they still need.
A weak presentation can also lead to poor resource choices, missed capacity gaps, and higher costs. Teams may overlook changes in demand or fail to plan for future work. These issues can affect budgets, schedules, and daily operations.
A well-organized capacity planning presentation puts the key details in one place. This guide explains how to assess capacity, forecast demand, choose useful visuals, and share clear recommendations with each stakeholder group.
What Is a Capacity Planning Presentation?
A capacity planning presentation shows how much work a team, business, or company can handle with its current resources. It also shows how much capacity may be needed in the future. This includes staff, time, equipment, budget, and other resources.
The main goal is to compare available capacity with expected demand. This helps managers see if their teams have enough resources to meet business goals. It also helps them spot gaps, plan new hires, manage workloads, and set better priorities.
For example, a company may have several projects planned for the next quarter. A capacity planning presentation can show how many employees are available, how much time each project needs, and where extra support may be required. With this information, decision-makers can plan resources based on clear data instead of guesswork.
What Are the Three Types of Capacity Planning?
Capacity planning helps businesses match their available capacity with their needs. It helps teams manage people, tools, time, and production. There are three main types of capacity planning. Each one focuses on a different part of business operations.
Workforce Capacity Planning
Workforce capacity planning focuses on people. It helps businesses check if they have enough employees to complete their work. It also helps managers assign tasks based on team skills, work hours, and availability.
For example, a company may have several projects due in the same month. Managers can review each employee's workload and assign tasks based on available time. They can also decide if they need to hire more staff or train current employees.
A capacity planning presentation can show team size, workload, available work hours, and staffing needs. This helps managers make better decisions about their workforce.
Resource Capacity Planning
Resource capacity planning focuses on the tools, equipment, materials, and other resources needed to complete work. It helps businesses check if they have enough resources to meet project or business needs.
For example, a construction company may need more machines and building materials for a new project. A resource plan helps managers check current stock, track resource use, and plan future needs.
In a presentation, you can use charts and tables to show resource availability, usage, and shortages. This gives decision-makers a clear view of where they need to add or adjust resources.
Production Capacity Planning
Production capacity planning focuses on how much a business can produce within a set period. It helps manufacturers match production output with customer demand. It also helps them manage equipment, labor, and production time.
For example, a factory may need to produce 5,000 units each month. Managers can review machine capacity, staff availability, and production time to check if the target is possible. They can then adjust schedules or add equipment to meet the target.
A capacity planning presentation can show production targets, actual output, machine usage, and production gaps. These details help managers review performance and plan future production needs.
Key Capacity Planning Strategies
Capacity planning helps a business match its resources with demand. Each business has different needs. Some plan ahead for future growth. Others adjust their resources as demand changes. The right strategy depends on business goals, budgets, and available resources.
Here are four common capacity planning strategies to include in your presentation.
Lead Capacity Planning
Lead capacity planning means adding resources before demand increases. A business prepares for future needs by hiring staff, buying equipment, or expanding its facilities.
This strategy helps a company handle a rise in demand without delays. It can also help maintain service quality during busy periods. However, adding resources too early can increase costs if demand stays low.
Example: A retail store hires extra staff before the holiday season to serve more customers.
Lag Capacity Planning
Lag capacity planning takes the opposite approach. A business adds resources only after demand increases. This means the company waits for clear signs of higher demand before making changes.
This strategy helps control costs. It also reduces the risk of paying for unused resources. However, the business may face delays or service issues while waiting for extra capacity.
Example: A factory buys more machines after customer orders rise beyond its current production capacity.
Match Capacity Planning
Match capacity planning takes a middle path between lead and lag strategies. A business adds resources in small steps as demand grows. This helps keep capacity close to actual needs.
The company can review demand at set times and make changes based on its findings. This approach helps control costs while keeping enough resources available.
Example: A delivery company adds a few more drivers each month as the number of orders increases.
Dynamic Capacity Planning
Dynamic capacity planning focuses on regular changes in demand. A business adjusts its resources based on current needs and demand forecasts. It may increase staff during busy periods and reduce shifts during slower periods.
This strategy helps businesses respond to changes in customer demand. It also supports better use of staff, equipment, and other resources.
Example: A hotel hires seasonal workers during peak travel months and reduces staff hours during quieter months.
A capacity planning presentation should explain how these strategies work and where each one fits. A simple comparison chart can help your audience review their benefits, costs, and possible risks. This makes it easier to choose a strategy that supports the company's goals.
How to Assess Current Capacity and Forecast Demand
A clear view of current capacity helps teams make better plans. It shows how much work a team can handle with its available resources. It also helps managers prepare for future needs. Start by reviewing the people, tools, time, and budget available. Then compare the current workload with expected demand. This gives decision-makers a clear view of resource needs and possible gaps.
Measure Available Resources
Start by listing the resources your team has. These may include employees, equipment, software, working hours, and budget. Check how much time each resource can provide for planned work.
For example, a team may have 10 employees. Each person works 40 hours per week. That gives the team 400 total work hours. However, meetings, training, and other tasks can reduce the time available for project work.
Use a simple table or chart to show each resource and its available capacity. This makes it easier for managers to review the numbers.
Analyze Current Workload and Resource Utilization
Next, review the work your team is handling right now. List active projects, daily tasks, deadlines, and assigned hours. Compare the total workload with the available capacity.
Resource utilization shows how much of a resource's available time is being used. For example, an employee who works 32 project hours out of a 40-hour week has an 80% utilization rate.
Use charts to show workload and utilization rates. These visuals help managers spot overloaded teams and unused resources. They also show where work needs to be shared across team members.
Forecast Future Demand
Current capacity only shows what your team can handle today. Future demand helps managers plan for upcoming work.
Review sales targets, project plans, customer needs, and expected business growth. Use past workload data to estimate how much work may come in over the next few months.
You can create three demand forecasts:
- Low demand: Shows the resource needs during a period of slower activity.
- Expected demand: Shows the most likely level of work based on current plans.
- High demand: Shows the resources needed during a period of increased activity.
Present these forecasts in a line chart or bar chart. This helps decision-makers compare different demand levels and plan their resources.
Identify Capacity Gaps and Resource Constraints
Once you know your current capacity and future demand, compare the two. This helps you find areas where resources may fall short.
For example, a team may have 400 available work hours per week. Its expected workload may reach 480 hours. This creates an 80-hour capacity gap.
Show these gaps in a chart or table. Highlight the teams, roles, or resources with the highest demand. Also list the main reasons behind each gap, such as staff shortages, limited equipment, or budget limits.
End this section with clear actions. Managers may need to hire more staff, adjust project deadlines, move tasks between teams, or invest in new tools. These steps help match available resources with future work.
How to Create a Capacity Planning Presentation
A good capacity planning presentation should help decision-makers understand current resources, future demand, and possible gaps. Each section should share clear information. It should also help the audience decide what needs to change and why.
Follow these steps to build a clear and useful presentation.
Start With an Executive Summary
Start your presentation with a short executive summary. Give the audience a quick view of the current capacity, expected demand, and main planning goals. Include the key points that need attention. You can mention major resource needs, expected costs, and the actions your team recommends. Keep this section brief. The audience should understand the main message before moving to the details.
Present Current Capacity and Available Resources
Show how much work your team can handle with its current resources. Include details about staff, equipment, tools, space, and other resources that support daily work.
Use charts or tables to present the data. For example, a table can show the number of team members, available work hours, and current workload.
This section helps decision-makers see what resources are already available. It also shows whether the current setup can support business needs.
Show Demand Forecasts
Next, present your expected demand over a set period. Use sales forecasts, project plans, customer needs, or other data provided by your team. A line chart can show how demand may change over time. You can also use a bar chart to compare demand across teams, projects, or departments. Include short-term and long-term forecasts. This gives the audience a clear view of future workload and helps them plan resource needs.
Highlight Capacity Gaps and Risks
Compare current capacity with expected demand. This helps show where your team may have too many or too few resources. Use a gap analysis chart to present the difference. Highlight areas where demand may exceed available capacity. Also, list the main risks. These may include staff shortages, equipment limits, project delays, or higher operating costs. Explain how each risk could affect daily work and business goals.
Recommend Resource Planning Strategies
After showing the gaps, present your recommended actions. Focus on how the team can manage its resources to meet future demand.
Your strategies may include:
- Hiring new staff to handle higher workloads.
- Training current employees to support more tasks.
- Moving resources between teams or departments.
- Buying new equipment or tools.
- Adjusting project schedules to balance workloads.
Explain why each strategy is a good fit. Link every recommendation to a capacity gap shown earlier in the presentation.
Present Budget Requirements and Expected Costs
Show how much money your proposed plan will need. Break down the costs into clear groups.
Include expenses such as hiring, training, equipment, software, and other resource needs. Use a table or bar chart to compare costs across different strategies. You can also show the expected return or savings from each plan. This helps decision-makers review the financial impact before approving the budget.
End With a Clear Action Plan
Finish your presentation with a clear action plan. List the steps your team needs to take to meet future capacity needs.
For each action, include:
- Task: What needs to be done?
- Owner: Who will handle it?
- Timeline: When should it be completed?
- Resources: What support is needed?
- Expected Result: What outcome should the team achieve?
Use a timeline or roadmap to show the order of tasks. End with the key decisions that need approval. This gives everyone a clear idea of what happens next.
Best Charts and Visuals for Capacity Planning Slides
Charts and visuals make capacity planning data easier to read. They help people compare resources, track demand, and spot gaps. The right chart also helps teams make better decisions. Each chart serves a different purpose. Choose one based on the data you want to present.
Bar Charts for Capacity Comparisons
Bar charts help compare available capacity with current resource use. You can use them to show the workload of each team, department, or project. Each bar represents a value. This makes it easy to see which teams have extra capacity and which ones need more support.
For example, a bar chart can compare the number of available work hours with the hours needed for each department. Use clear labels and simple colors. This helps viewers read the data without extra effort.
Line Charts for Demand Forecasts
Line charts show how demand changes over time. They work well for capacity forecasts. You can use them to show past demand and expected demand for the next few months.
Add a line for available capacity to compare it with forecasted demand. This helps teams see if future demand may exceed their current resources. It also gives them time to plan staffing, equipment, or other resource needs.
Waterfall Charts for Capacity Gaps
Waterfall charts show how different factors affect total capacity. They can help explain the gap between current capacity and required capacity. For example, start with the total available work hours. Then show the hours lost to leave, training, maintenance, or other tasks. End with the remaining capacity. This gives viewers a clear view of how each factor changes the final amount.
Gantt Charts for Resource Planning Timelines
Gantt charts show tasks, timelines, and resource assignments. They help teams see how work is spread across a project schedule. Each task appears as a bar along a timeline. You can use different colors to show teams, departments, or project stages. This makes it easier to spot overlapping tasks and busy periods. Teams can also use these charts to plan resource use across different project stages.
Dashboards for Capacity Overview
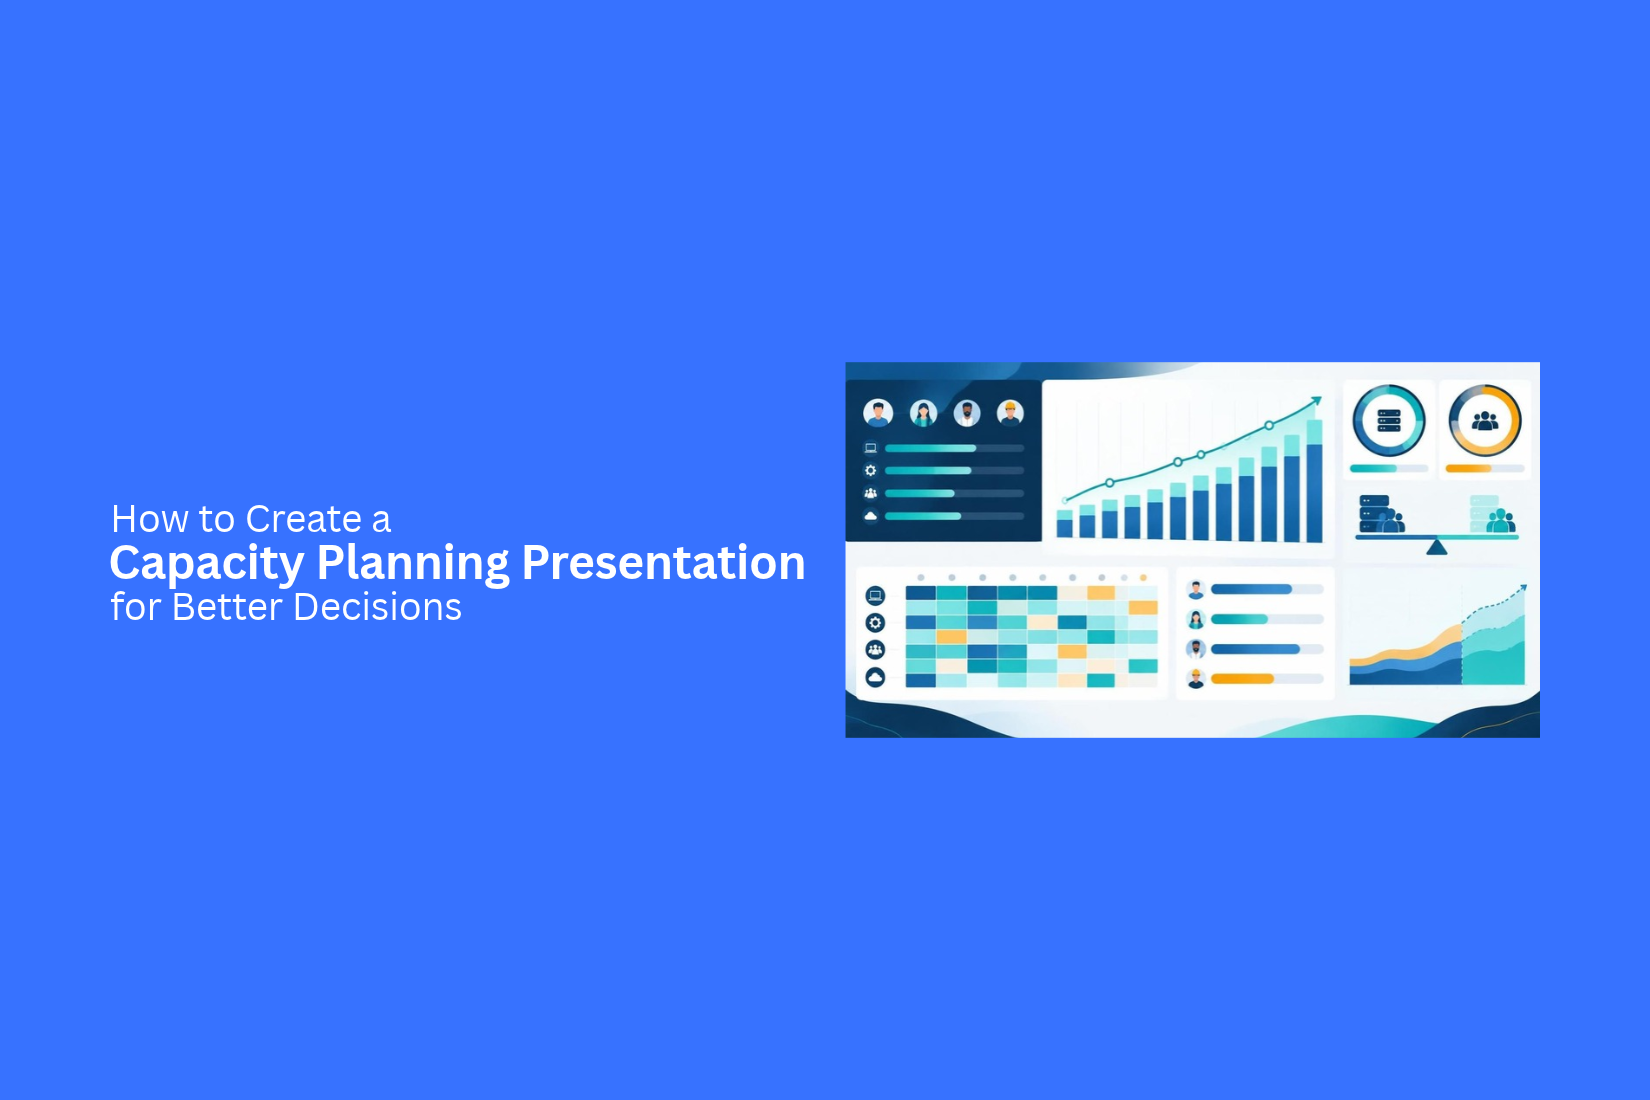
A capacity planning dashboard brings key data into one view. It gives managers a quick look at resource use, demand, and available capacity. You can add charts, progress bars, and key figures to show important details. For example, include total available hours, current workload, resource use, and forecasted demand. Use clear labels and keep the layout simple. This helps managers review capacity data and make decisions without going through several slides.
How to Present Capacity Plans to Different Stakeholders
A capacity plan can serve different purposes for different teams. Executives want to know how the plan affects business goals. Operations teams need clear details about workloads and resources. Finance teams focus on costs and budget needs. Your presentation should address each group's main concerns. Use simple language and clear visuals to explain the plan. This helps everyone understand what the business needs and why certain decisions matter.
Present Key Metrics and Financial Impact to Executives
Executives need a clear view of the business impact. They may not need every detail about daily tasks or team workloads. Focus on the key numbers that support major decisions.
Show metrics such as current capacity, expected demand, resource gaps, and planned growth. Use charts to compare current and future capacity. Add financial data to show how the plan may affect business costs and results. Keep this part short and direct. Highlight the main findings. Make it easy for executives to see where the business stands and what action is needed.
Show Workload and Resource Needs to Operations Teams
Operations teams need practical details about daily work. They need to know how much work is expected and whether the team has enough people, tools, and time to handle it. Use workload charts to show current tasks and future demand. Add a resource breakdown to show how many people or tools each team needs. You can also use a timeline to show major tasks and planned resource use. Keep the data easy to read. Show areas with too much work or unused capacity. This gives operations teams a clear view of where changes are needed.
Explain Budget Requirements to Finance Teams
Finance teams need to understand the cost of the capacity plan. They want to know how much money the business needs and how the funds will be used. Break down the budget into clear cost groups. These may include staff costs, equipment, software, and other resource needs. Use a table or bar chart to show the estimated cost of each group. Add a comparison of the current budget and the proposed budget. Explain the reason for each major cost. This helps finance teams review the numbers and make budget decisions.
Address Stakeholder Concerns and Questions
Stakeholders may have different views about the capacity plan. Some may question the budget. Others may ask about workload, staffing, or future demand. Your presentation should leave room for these concerns. Add a question-and-answer section near the end. List the main points that may need more explanation. Use clear data to support your answers. You can also show the risks linked to the plan and explain how the team will handle them. Give each stakeholder group time to share its concerns. Record key questions and agreed actions. This helps teams stay on the same page and move toward clear decisions.
How to Track and Update Your Capacity Plan
A capacity plan needs regular updates. Resource needs can change as projects grow or business goals shift. Your presentation should show the latest data. This helps teams make better choices and use resources wisely. Regular reviews also help managers spot issues before they affect project work.
Monitor Resource Utilization
Resource utilization shows how much of your available capacity is in use. Track the time, staff, equipment, and other resources assigned to each task. Compare planned capacity with actual usage.
Use charts or tables to show these numbers. A simple bar chart can show which teams have too much work. It can also show which teams have room for new tasks. This gives managers a clear view of resource use.
Track Capacity Gaps and Demand Changes
Capacity gaps appear when available resources do not match the work needed. A team may have more tasks than it can handle. Another team may have extra time or unused resources.
Track these gaps in your presentation. Show the difference between current capacity and expected demand. Add notes about changes in project needs, staff levels, or workloads. This helps managers see where they need to move resources or adjust plans.
Set Monthly or Quarterly Review Schedules
Set a regular schedule to review your capacity plan. Monthly reviews work well for teams with frequent changes in workload. Quarterly reviews can help with longer-term planning. Use each review to check resource use, project demand, and team capacity. Record key changes from the last review. Add action items for any gaps that need attention. A fixed review schedule keeps the plan current and gives teams a clear time to discuss new needs.
Update Your Presentation With New Data
Your capacity planning presentation should match the latest business data. Update charts, tables, and figures after each review. Remove old numbers that no longer reflect current needs. Add a date to each version of your presentation. This helps readers know which data is current. You can also include a short update section to show what has changed since the last review. Keep the layout clear so managers can compare past plans with current results.
Common Mistakes to Avoid in a Capacity Planning Presentation
A capacity planning presentation should help people make clear decisions. Some common mistakes can make this harder. Poor data, crowded slides, and missing cost details can affect how people understand the plan. Avoid these mistakes to keep your presentation clear and useful.
Using Outdated or Incomplete Data
Old or incomplete data can lead to poor planning decisions. Your team may not get a clear view of current resources, workloads, or available capacity.
Use recent data from reliable records. Check that all key details are included. Review staff levels, equipment, budgets, and current workloads. Also, update your figures before sharing the slides. This helps your audience work with accurate information.
Ignoring Future Demand
A capacity plan should cover current needs and future demand. A presentation that only shows current workloads may miss upcoming needs.
Add demand forecasts to your slides. Show how workload may change over the next few months or years. Include plans for new projects, seasonal changes, and expected growth. This gives decision-makers a better view of future resource needs.
Overloading Slides With Too Many Numbers
Too many numbers can make your slides hard to read. Your audience may find it difficult to spot the key points. A crowded slide can also take attention away from your main message.
Show only the figures that support your main point. Use charts, tables, and short labels to present data. Keep detailed figures in an appendix or backup slides. Highlight key numbers so your audience can find them quickly.
Missing Cost and Risk Analysis
Capacity planning is not only about resources. It also involves costs and possible risks. A plan may look good on paper but fail due to budget limits or resource gaps.
Add a cost breakdown to your presentation. Show the expected costs of hiring staff, buying equipment, or expanding operations. List possible risks, such as budget cuts, staff shortages, or delays. Include steps to manage these risks. This helps decision-makers review the plan before approving it.
Presenting Data Without Clear Recommendations
Data alone does not tell your audience what to do next. Your presentation should connect the findings to clear actions.
End your presentation with specific recommendations. State which resources need attention and what steps the team should take. Add a timeline and assign responsibility for each action. Also, explain which decisions need approval. This gives your audience a clear path from the planning stage to action.
Tips to Make Your Capacity Planning Presentation More Effective
A good capacity planning presentation should help people understand the current situation and make better choices. Keep the slides clear and easy to follow. Focus on key data, useful visuals, and practical actions. Each slide should help the audience understand a specific part of the plan.
Keep Each Slide Focused on One Message
Give each slide one main message. Avoid adding too many ideas to a single slide. This makes the content easier to read and understand.
For example, use one slide to show current team capacity. Use another to show future demand. You can then add a separate slide for resource gaps. This gives each topic enough space and keeps the presentation organized.
Use Clear Charts and Visuals
Charts help the audience understand capacity data. They also make it easier to compare numbers and spot changes. Choose a chart that fits the data you want to show. Use bar charts to compare team capacity across departments. Use line charts to show changes in demand over time. A table can work well for a list of available resources. Keep labels short and make sure the numbers are easy to read.
Highlight Important Metrics
Your audience needs to see the numbers that matter most. Highlight key metrics so people can find them quickly.
These may include:
• Current capacity
• Available resources
• Resource utilization rate
• Projected demand
• Capacity gaps
• Workload per employee
• Resource costs
Use large numbers or simple charts to show these metrics. Add short notes to explain what each number means. This helps the audience understand the current position without reading too much text.
Support Recommendations With Data
Every recommendation should have clear data behind it. This helps people understand why a change is needed.
For example, your data may show that a team has more work than it can handle. You can use this finding to suggest hiring new staff or moving tasks to another team. Show the numbers that support your suggestion. This gives decision-makers a clear reason to approve the plan.
Include Clear Next Steps
End your presentation with a clear action plan. The audience should know what needs to happen after the meeting.
List the main tasks, the people responsible, and the target dates. You can also include the resources needed for each task. Keep the plan simple and easy to follow.
For example, your next steps may include reviewing team workloads, assigning available staff, hiring new team members, or checking future demand. Clear actions help teams move from planning to execution.
Final Verdict
A capacity planning presentation helps businesses understand their current resources and prepare for future demand. It gives managers a clear view of available staff, workloads, equipment, costs, and resource gaps. With the right charts and data, teams can review their needs and make better decisions.
Keep your slides focused on key findings. Support each recommendation with clear data. Add a practical action plan with tasks, owners, and timelines. Also, review your capacity plan on a regular basis to keep the information current. A clear presentation helps teams use resources wisely, manage workloads, and prepare for upcoming business needs.
Frequently Asked Questions
1. What is the main purpose of a capacity planning presentation?
The main purpose is to compare available resources with expected demand. It helps managers identify resource gaps, plan workloads, and make better business decisions.
2. What are the three main types of capacity planning?
The three main types are workforce capacity planning, resource capacity planning, and production capacity planning. Each focuses on a different business need.
3. What should a capacity planning presentation include?
It should include an executive summary, current capacity, available resources, demand forecasts, capacity gaps, resource planning strategies, budget needs, and an action plan.
4. Which charts are best for capacity planning presentations?
Bar charts work well for capacity comparisons. Line charts show demand forecasts. Waterfall charts explain capacity gaps. Gantt charts show resource timelines. Dashboards bring key metrics into one view.
5. How do you calculate a capacity gap?
Subtract available capacity from required capacity. For example, a team has 400 available work hours but needs 480 hours. The capacity gap is 80 hours.
6. How often should you update a capacity planning presentation?
Review the presentation monthly or quarterly. Update the data after each review. This keeps resource levels, workloads, and demand forecasts current.
7. What common mistakes should you avoid in a capacity planning presentation?
Avoid using old data, ignoring future demand, adding too many numbers, missing cost details, and sharing data without clear recommendations.
8. How can you make a capacity planning presentation easier to understand?
Give each slide one main message. Use clear charts and short labels. Highlight key metrics and support recommendations with data. End with clear next steps and assigned tasks.



You may also be interested in ...

Tips To Create A Great Infographic
Infographics Have been around for a while, but not many people know about them or are their preferred presentation choice. If...
08 Jun, 2024

3 Steps To Create The Best Presentation...
Presentations are something wonderful when well done, you can captivate an audience or be super interested in what another pe...
23 Jun, 2024

3 Tips For Your Next Presentation You MU...
PowerPoint presentations are perfect for explaining a topic and communicating your ideas with a visual aid. But most people s...
08 Jun, 2024