How to Transfer Excel Data to PowerPoint Slides
Moving Excel data into PowerPoint slides can be done in several ways. You can use simple copy and paste for quick tasks. You can also use Object Linking and Embedding for live data connections. Other options include inserting objects, using VBA scripts, or third-party tools for faster workflows. The right method depends on how complex your data is and how often it changes.
Reports, dashboards, and meeting slides often rely on Excel data. Manual work can slow the process and create formatting issues. This guide explains step-by-step methods to transfer Excel data into PowerPoint slides. It covers tables, charts, linking options, and automation techniques so you can build clear and accurate presentations.
Why Convert Excel to PowerPoint Presentations
Excel stores numbers in rows and columns. PowerPoint shows ideas in slides. These tools serve different roles in business work. One focuses on detail. The other focuses on clear communication. This gap creates a need for conversion. Here are reasons this conversion matters.
Visual Impact Over Raw Data
Excel presents dense tables. Many rows and columns appear at once. This slows understanding for many viewers. PowerPoint changes that format into slides. Each slide holds a clear point. Charts replace large tables. Key figures stand out. This shift helps the message feel clearer. Viewers see patterns faster. Decisions take less effort.
Stakeholder Preferences
Many business audiences do not review raw spreadsheets. Large datasets can feel heavy and hard to follow. Slides match how meetings run. Teams move through points step by step. Each slide supports a single idea. This format keeps attention steady. It also reduces confusion during discussions. Messages stay clear across different roles in a meeting.
Professional Presentation Standards
Business settings expect clear and structured communication. Raw Excel files do not always meet that need. PowerPoint supports a clean layout. Fonts, spacing, and visuals stay consistent. Information appears in a guided flow. This structure supports better review in meetings. It also aligns with common reporting practices in companies.
What You Will Learn
This section explains what you can do after reading this guide.
• How to move Excel data into PowerPoint slides
• How to copy tables without breaking layout
• How to bring charts into slides for clear viewing
• How to keep data readable after transfer
• How to use simple methods for quick results
• How to keep Excel updates reflected in slides
How Excel and PowerPoint Work Together
Excel and PowerPoint serve different roles. Excel holds data in rows and columns. PowerPoint shows information on slides for an audience. Charts and tables move from Excel into PowerPoint. This keeps numbers and visuals in one flow. A chart built in Excel can appear in a slide without rebuilding it.
Some PowerPoint charts stay linked to Excel data. Changes in Excel show up in the slide chart. Reports stay aligned with the latest numbers without extra work. Teams often rely on both tools for reporting. Excel manages the data. PowerPoint presents the message in a clear way.
Types of Data You Can Transfer
Excel holds different kinds of information. Each one can move into slides in its own way. Text data comes from labels, names, and notes in cells. This helps explain ideas on slides. Numbers and formulas show values, totals, and calculations. These often support reports and results.
Tables and ranges group rows and columns together. They keep structured information in one place. Charts and graphs show data in a visual form. They help present patterns in a clear way.
Static vs Linked Data
Excel data can move into PowerPoint in two main ways. Each method changes how the slides behave after you add the data. Static data means the content gets copied into PowerPoint. It stays fixed. You can edit it inside PowerPoint, but it no longer updates from Excel. This works well for reports that are finished. It also works well for slides that will not change often.
Linked data keeps a connection between Excel and PowerPoint. Any change in the Excel file can reflect in the slides. This saves time when numbers update often. It also reduces manual edits. The link depends on the Excel file staying in the same place. If the file moves, the link can break.
Static data fits final presentations and simple sharing. Linked data fits live reports and repeated updates. The choice depends on how often the data changes and how much control you need inside PowerPoint.
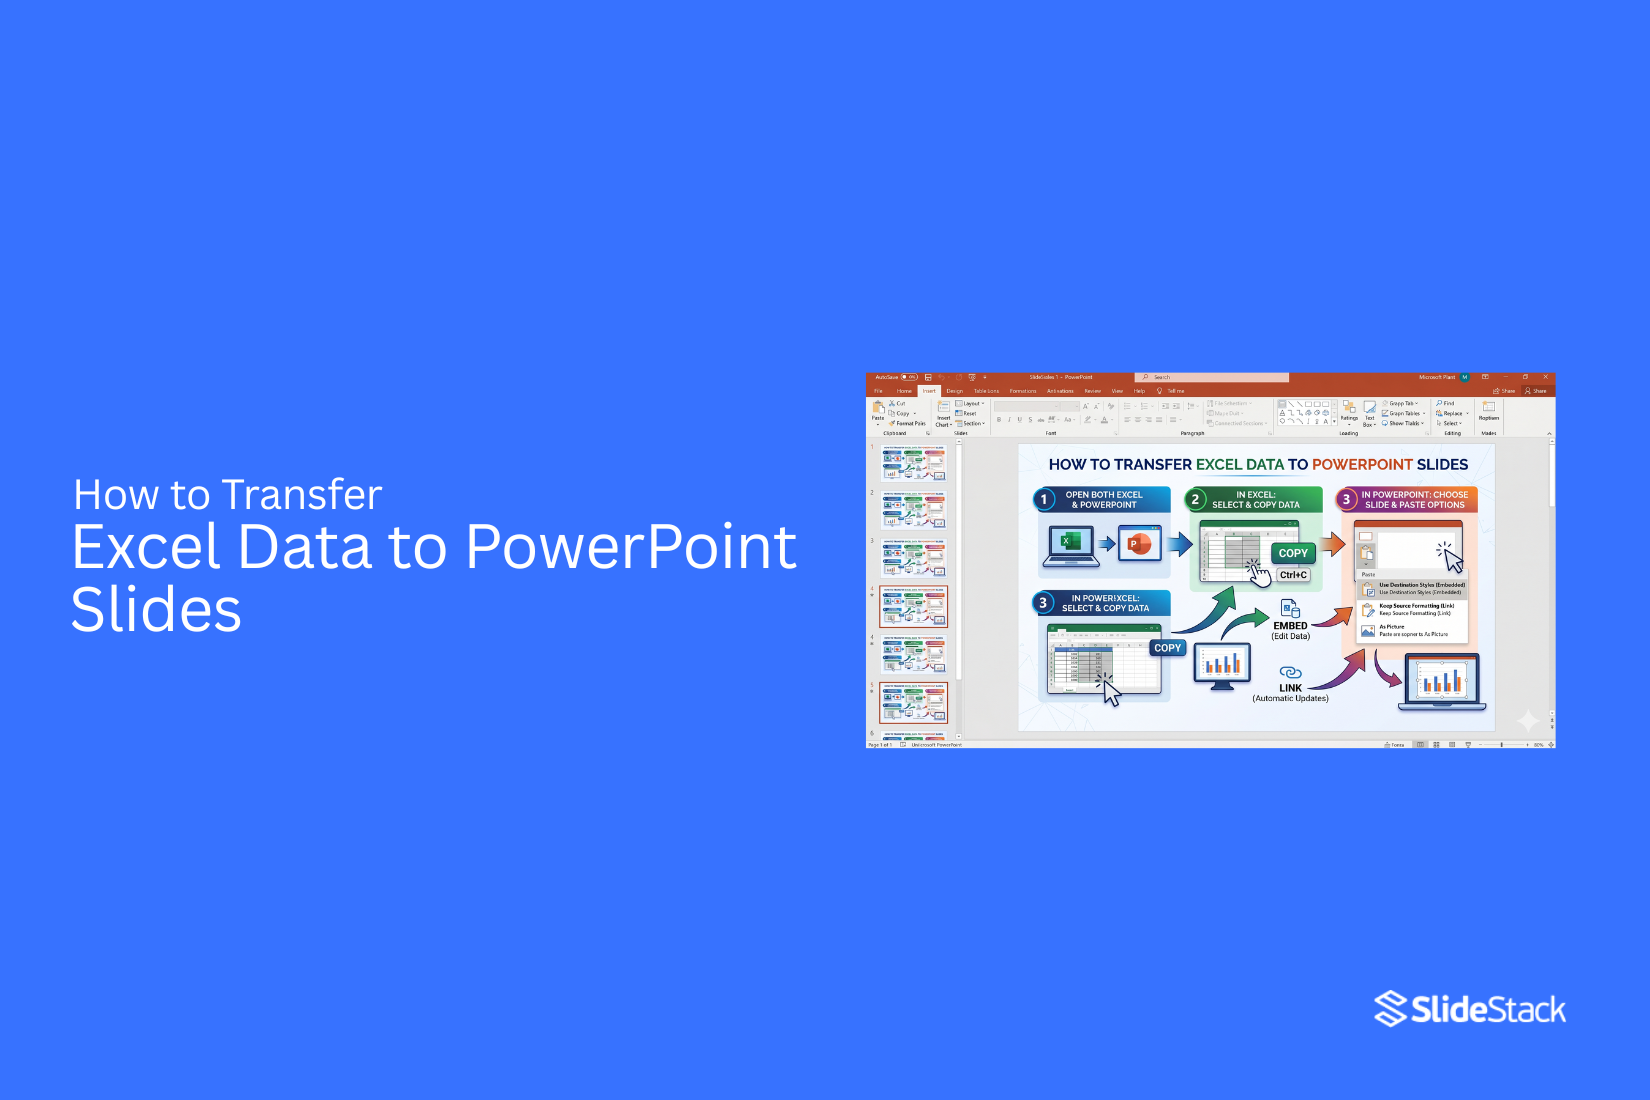
How to Transfer Excel Data to PowerPoint Slides Step by Step
Moving data from Excel to PowerPoint helps turn raw numbers into clear visuals for presentations. This guide shows simple steps and methods to transfer your data without confusion or wasted time.
Method 1: Manual Copy and Paste (Basic Transfer)
The most straightforward approach involves copying Excel content and pasting it directly into PowerPoint slides.
Step-by-Step Process
- Select Your Excel Data: Highlight the cells, tables, or charts you want to move.
- Copy the Content: Press Ctrl + C on Windows or Cmd + C on Mac.
- Open PowerPoint: Go to your presentation and pick the slide you need.
- Paste with Options: Press Ctrl + V, then choose the paste option that fits your goal:
• Keep Source Formatting (keeps Excel look)
• Use Destination Theme (matches slide design)
• Picture (turns data into a static image)
• Keep Text Only (removes formatting)
When to Use This Method
Manual copy and paste works best for:
• One-time presentations with fixed data
• Small datasets under 50 rows
• Slides that do not need updates later
• Quick internal reports or updates
Limitations and Drawbacks
This method comes with clear limits:
• No Dynamic Updates: Excel changes do not update in PowerPoint
• Formatting Issues: Tables often need manual fixing after pasting
• Time Use: Large data takes repeated copy and paste actions
• Quality Loss: Charts may look less sharp when pasted as images
• Human Error: Repeated steps increase the chance of mistakes
Method 1: Manual Copy and Paste (Basic Transfer)
Manual copy and paste moves Excel data into PowerPoint without a live connection. The data becomes static once placed in the slide. It works well for simple reports and one-time presentations. No link remains between the two files.
How OLE Works
Object Linking and Embedding creates a connection between Excel and PowerPoint. Excel keeps the original data. PowerPoint shows a linked version of that data. Updates in Excel can reflect inside PowerPoint through this connection. The system keeps Excel formatting inside the slide view.
Setting Up OLE Links:
- Select the required range or chart in Excel
- Copy the selection
- Open PowerPoint
- Go to Home → Paste → Paste Special
- Select “Paste Link”
- Choose “Microsoft Excel Worksheet Object” or “Microsoft Excel Chart Object”
- Confirm to create the linked object
Maintaining Live Connections
OLE links depend on file access and stable paths.
• Keep Excel and PowerPoint files in the same folder structure
• Store files on shared drives for team use
• Avoid renaming or moving source files after linking
• Recheck links after file updates or relocation
Automatic vs. Manual Updates
OLE links can refresh in two ways. Automatic updates refresh data when the PowerPoint file opens. Manual updates require user action on the linked object. Automatic mode suits reports that change often. Manual mode gives control over update timing before sharing.
Troubleshooting Common Issues
Broken Links: Links break after file moves or renaming. Fix this through File → Info → Edit Links to Files in PowerPoint. Select the broken link and update the source path.
Performance Issues: Multiple linked objects slow down slides. Large datasets increase load time. Reducing linked items improves slide performance.
File Size Problems: Linked Excel objects increase PowerPoint file size. This can affect sharing and upload speed. Converting final slides to static content reduces file size impact.
Method 3: PowerPoint's Insert Object Feature
PowerPoint's Insert Object feature adds Excel content inside a slide or connects it to an Excel file. It works in two ways. One keeps the data inside PowerPoint. The other keeps a live link to Excel.
Built-in PowerPoint Functionality
Insert Object places Excel data into a slide as an object.
- Open PowerPoint
- Open the Insert tab
- Choose Object
- Select Create from File
- Pick the Excel file
- Press Insert
- Tick Link for connected data
- Leave Link unticked for a fixed copy
- Tick Display as an icon to open the file from a small icon on the slide
The Excel content now appears inside the slide area.
Embedding vs Linking Options
Embedding
Excel data sits inside the PowerPoint file.
• Pros: One file holds everything, no need for an Excel file later
• Cons: File size grows, no updates from Excel changes
• Best use: Final slides that stay the same after sharing
Linking
PowerPoint stays connected to the Excel file.
• Pros: Excel changes can appear in slides, and a smaller PowerPoint file
• Cons: Excel file must stay in the same place, broken links can happen
• Best use: Reports that change often
Formatting Considerations
Excel objects keep their original look after insertion. This can affect slide design.
• Adjust Excel layout before adding it to slides
• Match fonts and spacing with slide style
• Remove extra lines in tables
• Resize the object to fit the slide space
• Place charts away from text blocks for clear reading
Method 4: Using VBA Scripts for Automation
VBA handles repeat tasks between Excel and PowerPoint with direct control. A script can open both apps, move data, and place it into slides without manual steps. This method supports structured workflows where speed and consistency matter.
Custom Automation Scripts
A basic VBA script manages the full flow from Excel to PowerPoint. It opens PowerPoint, reads Excel data, creates a slide, pastes content, then saves and closes the file.
Sub ExcelToPowerPoint_Automation()
Dim pptApp As Object
Dim pptPres As Object
Dim pptSlide As Object
Dim excelRange As Range
Set excelRange = ThisWorkbook.Sheets("Sheet1").Range("A1:D10")
Set pptApp = CreateObject("PowerPoint.Application")
pptApp.Visible = True
Set pptPres = pptApp.Presentations.Add
Set pptSlide = pptPres.Slides.Add(1, 1)
excelRange.Copy
pptSlide.Shapes.Paste
pptPres.SaveAs "C:\Reports\ExcelReport.pptx"
pptPres.Close
pptApp.Quit
End Sub
This script builds a direct bridge between Excel data and a PowerPoint slide deck.
Technical Requirements
• Microsoft Excel installed
• Microsoft PowerPoint installed
• VBA editor enabled in Excel
• PowerPoint Object Library referenced (optional for early binding)
• File path access for saving output presentations
• Basic understanding of ranges, objects, and slide structure
Example Code Snippets
Chart Transfer Script
Charts often need cleaner handling than raw data. This script moves an Excel chart into PowerPoint as a slide object.
Sub Transfer_Chart_To_PPT()
Dim pptApp As Object
Dim pptPres As Object
Dim pptSlide As Object
Set pptApp = CreateObject("PowerPoint.Application")
pptApp.Visible = True
Set pptPres = pptApp.Presentations.Add
Set pptSlide = pptPres.Slides.Add(1, 1)
ActiveSheet.ChartObjects(1).Chart.Copy
pptSlide.Shapes.Paste
End Sub
The chart stays intact with its formatting during transfer.
Table Transfer with Formatting
Tables need structure control during export. This script copies a selected range and positions it inside a slide with defined placement rules.
Sub Transfer_Table_With_Formatting()
Dim pptApp As Object
Dim pptPres As Object
Dim pptSlide As Object
Dim dataRange As Range
Dim pastedShape As Object
Set dataRange = ThisWorkbook.Sheets("Sheet1").Range("B2:F12")
Set pptApp = CreateObject("PowerPoint.Application")
pptApp.Visible = True
Set pptPres = pptApp.Presentations.Add
Set pptSlide = pptPres.Slides.Add(1, 1)
dataRange.Copy
Set pastedShape = pptSlide.Shapes.Paste(1)
pastedShape.Left = 50
pastedShape.Top = 80
pastedShape.Width = 600
End Sub
Method 5: Third-Party Conversion Tools
Third-party conversion tools handle file transfers between Excel and PowerPoint using online or software-based converters. These tools process files through automated systems. The output depends on how each tool interprets the source data and layout.
Many users rely on them for speed and reduced manual work. The results vary based on file size, formatting complexity, and tool design.
Available Online Converters
- Smallpdf
- Zamzar
- CloudConvert
- iLovePDF
- Aspose Cells
- Online2PDF
Each tool follows its own conversion method. Some focus on document structure. Others focus on visual layout.
Pros and Cons
Advantages
• Handles file conversion without manual copying
• Saves time for large files
• Works across devices with internet access
• Supports multiple file formats
• Reduces repetitive formatting work
Disadvantages
• Requires uploading files to external servers
• File security can be a concern for sensitive data
• Formatting changes often appear after conversion
• Limited control over slide design output
• Some tools restrict file size or usage frequency
• Advanced Excel features may not transfer correctly
Quality Considerations
Conversion quality depends on how the data is structured in the original file.
• Formulas often convert into static values, removing calculation ability
• Charts may lose styling or scale accuracy during transfer
• Templates can break, especially with custom layouts or branding elements
• Large datasets may become misaligned or split across slides
• Embedded objects, such as images or icons, may shift position or reduce quality
These limitations affect presentation accuracy. Manual adjustment is often needed after conversion to restore structure and clarity.
Method 6: AI-Powered Presentation Automation
AI tools change how presentations are built. Earlier methods depend on manual work in Excel and PowerPoint. Each update takes time. Each slide needs attention.
AI-powered automation shifts this process into a system. Data moves into slides without repeated manual effort. Output becomes faster. Structure stays consistent. Teams spend less time on formatting and more time on decisions.
Modern Automation Solutions
AI presentation platforms remove many manual steps from reporting workflows. These tools connect data sources and presentation formats in one system.
Instead of copying numbers or rebuilding charts, the system handles layout and updates. Data flows from source files into ready-made slide structures. The focus moves from building slides to managing information.
Platforms like Rollstack represent this shift. Rollstack connects business data tools with presentation formats. It turns raw data into updated slides without manual rebuilding. Reports stay aligned with the latest numbers across teams and departments.
Using Rollstack
Rollstack works as a structured automation layer between data and presentations. It links datasets with slide templates.
The system keeps formatting stably while content updates in the background. Teams do not rebuild slides for every reporting cycle. The same structure can support weekly, monthly, or quarterly updates.
This approach reduces repeated work. It also lowers the chance of errors that come from manual edits.
Scaled Report Creation
AI-powered systems support large-scale reporting needs across organizations. One setup can generate multiple outputs from a single data source.
• Monthly business reports update automatically across all regions
• Sales dashboards convert into presentation slides without manual edits
• Financial summaries stay aligned with live data feeds
• Marketing performance reports refresh across all campaign decks
• Leadership updates maintain consistent formatting across departments
Each output follows the same structure. Data stays synchronized. Teams avoid duplication of effort across different versions of the same report.
AI-driven automation turns presentation creation into a repeatable system. It replaces repetitive slide building with structured data flow.
How to Insert an Excel Table into PowerPoint
Moving a table from Excel to PowerPoint helps bring data into a slide format. The process uses copy and paste. Small tables work best for this method. Large tables may need adjustments after pasting. Start in Excel.
Highlight the table you want. Use Ctrl + C or right-click and select Copy. Move to PowerPoint. Open the slide where the table should appear. Click on the space where the table will go. Press Ctrl + V or use the Paste option in the menu. After pasting, a set of paste choices appears. Each option changes how the table looks and behaves in PowerPoint.
Use Destination Styles
This option matches the PowerPoint theme. The table takes the slide colors and fonts. The structure stays the same, but the look changes to fit the presentation style. Pick this option for slides that need a clean and unified design.
Keep Source Formatting
This option keeps the Excel look. Colors, borders, and fonts stay the same as in the spreadsheet. PowerPoint does not change the style. Use this choice when the Excel design matters more than the slide design.
Embed from Excel
This option links the table to the Excel file. Changes made in Excel can update inside PowerPoint. The table stays connected to the original file. Use this when the data changes often and needs updates inside slides.
Paste as a Picture
This option turns the table into an image. The content cannot be edited in PowerPoint. It stays fixed as a visual. Use this for final slides where data should not change.
Keep Text Only
This option removes all formatting. Only the raw data stays. The table becomes plain text inside PowerPoint. This works for quick edits. It also helps when a full redesign is needed inside PowerPoint.
How to Insert an Excel Chart into PowerPoint
Moving a chart from Excel to PowerPoint follows a simple pattern. The main difference is how the chart behaves after it is placed. Some options keep a live connection to Excel. Other options turn the chart into a fixed image. Each option changes editing and updating.
Start in Excel. Open the file that contains the chart. Click the chart area. Press Ctrl + C or right-click and copy. Move to PowerPoint. Open the slide where the chart will go. Click the slide space. The next step depends on how the chart should work inside the slide.
Use Destination Theme and Embed Workbook
This option matches the PowerPoint style and stores the chart data inside the file. Paste the chart into the slide. Pick “Use Destination Theme and Embed Workbook” from the paste choices. PowerPoint adjusts colors and fonts to match the slide theme. The chart stays editable inside PowerPoint. Excel is not needed to update it. Changes are made inside the PowerPoint file. This works well for fixed reports that still need editing access.
Keep Source Formatting and Embed Workbook
This option keeps the exact look from Excel. Paste the chart and choose “Keep Source Formatting and Embed Workbook.” The chart keeps Excel colors, fonts, and layout. The data is stored inside PowerPoint. Edits remain possible inside the presentation file. This option fits cases where Excel styling must stay unchanged.
Use Destination Theme and Link Data
This option connects PowerPoint to the Excel file. Paste the chart and select “Use Destination Theme and Link Data.” The chart changes style to match PowerPoint. The data stays linked to Excel. Updates in Excel reflect inside PowerPoint. The Excel file must stay in the same location. Moving or renaming it breaks the link. This works for reports that need live updates.
Paste as Picture
This option turns the chart into a static image. Paste the chart and choose “Paste as Picture.” The chart cannot be edited after this step. No link to Excel remains. The image keeps the exact look at the time of pasting. This works for final slides that do not need changes later.
What are the Pros and Cons of Linking an Excel File to PowerPoint
Linking an Excel file to PowerPoint connects spreadsheet data to slides. The data stays tied to the original Excel file. Linking an Excel file to PowerPoint has various pros and cons. A few of these are listed below.
Pros
No Need to Recreate Data: You can link Excel spreadsheets, tables, and charts to PowerPoint instead of building them again inside slides. This reduces extra work.
Consistent Data: The same numbers appear in both Excel and PowerPoint. This keeps information aligned across files.
Fewer Manual Errors: Data comes directly from Excel. This lowers the chance of typing mistakes on slides.
Better Data Handling: Large tables from Excel can appear on slides without rebuilding them. This helps with reports that contain many rows and columns.
Time Saving: Updates happen in Excel. The linked slides reflect those updates. This reduces repeated slide editing.
Cons
File Dependency: PowerPoint content relies on the Excel file. Moving, renaming, or deleting the Excel file breaks the connection. Slides may stop showing updated data.
Sharing Issues: Sending a presentation alone can cause missing data problems. The linked Excel file also needs to be shared together with the slides.
Backup Challenges: Both files must stay stored together. Missing one file can make the other less useful.
Limited Context: Linked data often appears as raw numbers or tables. An extra explanation must be added in PowerPoint to make the meaning clear.
Common Mistakes to Avoid
Copying data from Excel into PowerPoint seems simple. Small errors can still cause trouble later. One common mistake is pasting raw tables without checking formatting. Numbers may shift, or text may wrap in a messy way. Slides then look uneven and hard to read.
Another issue comes from using the wrong paste option. Some users paste as an image without checking if updates are needed. Others link data but forget the source file path. Both choices can affect how the data appears later.
Large datasets also create problems. A full spreadsheet on a slide reduces clarity. The audience may struggle to focus on key points. Another mistake is skipping a quick review after insertion. Spacing, alignment, and font size often need small fixes. A short check helps the slide look clean and clear.
Best Practices for Excel to PowerPoint Conversion
Clean Excel data leads to clearer PowerPoint slides. Simple structure helps every slide look easier to read. Start with organized data in Excel. Each column should have one type of information. Keep headings clear and short. Remove empty rows and extra spaces. Consistent formatting helps slides stay neat. Use the same number style across rows. Keep text size and fonts uniform inside the sheet. Avoid mixing too many colors.
Charts need careful setup. Select only the data that supports the message. Remove extra grid lines that add noise. Keep labels readable and direct. Clutter slows down understanding. Large tables do not work well on slides. Break big data into smaller parts. Focus each slide on one message. Alignment affects how professional slides look. Check spacing after moving content into PowerPoint. Adjust widths so nothing looks stretched or cut off.
Final Notes
Moving Excel data into PowerPoint can be done in many ways. Each method serves a different need. Simple copy and paste works for quick tasks. It is best for small and fixed data. Linking Excel to PowerPoint keeps data updated. It helps when reports change often. Embedding keeps data inside the PowerPoint file. It removes the need for the original Excel file in some cases. VBA scripts help automate repeated work. They save time for large or repeated reports.
Third-party tools can speed up the process. They may change layout or formatting. AI tools reduce manual slide building. They keep data and slides in sync through automation. Clean Excel data improves slide quality. A clear structure helps slides stay easy to read. Small mistakes in paste options or file links can cause broken results. Checking each step helps avoid issues. Simple formatting choices make slides clearer. Each slide should focus on one main point.
FAQs
Can I move Excel data to PowerPoint without copying and pasting?
Yes. You can use linking, embedding, VBA scripts, or third-party tools. Each method works in a different way based on how you want the data to appear and update.
What is the easiest way to transfer Excel data into PowerPoint?
Copy and paste is the simplest option. It works well for small tables, charts, or one-time reports that do not need updates.
What happens when I link Excel data to PowerPoint?
The slide stays connected to the Excel file. Any change in Excel can appear in PowerPoint. The link can break if the Excel file is moved or renamed.
Should I embed or link Excel data in PowerPoint?
Embedding keeps the data inside the PowerPoint file. Linking keeps a connection to Excel. Embedding fits static reports. Linking fits data that changes often.
Can Excel charts update automatically in PowerPoint?
Yes, if they are linked. Updates in Excel reflect in PowerPoint when the link is active.
Why does my Excel table look broken after pasting it into PowerPoint?
This usually happens due to paste settings or formatting differences between Excel and PowerPoint. Choosing the right paste option can fix most issues.
Do I need Excel installed to view linked PowerPoint files?
Yes. The Excel file must be accessible for linked data to display correctly.
Are third-party tools safe for converting Excel to PowerPoint?
Most tools are safe, but they may require uploading files online. This can be a concern for sensitive data.
Can I automate Excel to PowerPoint transfer?
Yes. VBA scripts can automate the process and move data directly into slides.
What is the best method for business reports?
It depends on your needs. Linked data works well for live reports. Embedding or copy-paste works better for final presentations.


You may also be interested in ...

How To Create An Eye-Catching Portfolio
If you’re looking to create an eye-catching portfolio, this post will come in handy. In this article, you can find the easies...
23 Jun, 2024

How To Easily Create An Infographic
Infographics are the perfect way to make a presentation that will impact an audience, but their design and composition might...
08 Jun, 2024

PowerPoint Template Tips & Tricks You Ne...
PowerPoint seems to be an unknown world for many people, especially those who have been assigned to create a presentation out...
08 Jun, 2024