How to Present Key Result Areas in a Presentation

Presenting Key Result Areas (KRAs) can be hard when a slide has too many goals, measures, targets, and results. A crowded KRA presentation can make it hard for your audience to see what each area means and why it matters.
A clear KRA presentation puts information in a simple order. Start with the business goal, connect it to each KRA, then show the measures, targets, results, and gaps. Simple charts and focused slides can make the message easier to follow. This guide explains how to present KRAs, build a KRA model, show performance data, create a KRA cascade, and present results to executives.
What Are Key Result Areas (KRAs)?
Key Result Areas, or KRAs, are the main areas where a person or team is expected to produce results. They show what matters most in a role and connect daily work with larger business goals. A good KRA is clear and focused. It helps employees understand what they need to achieve and gives managers a way to review progress.
KRA Meaning and Definition
KRA stands for Key Result Area. It refers to a major part of a job that has a clear result or outcome.
For example, a sales manager may have KRAs such as:
• Increase monthly sales
• Improve customer retention
• Grow new customer accounts
• Meet revenue targets
KRAs focus on important results rather than every task an employee performs.
Key Result Area vs. Key Responsibility Area
Key Result Area and Key Responsibility Area are related but have different purposes.
A Key Result Area focuses on the result a person needs to achieve. A Key Responsibility Area focuses on the main duties of the role.
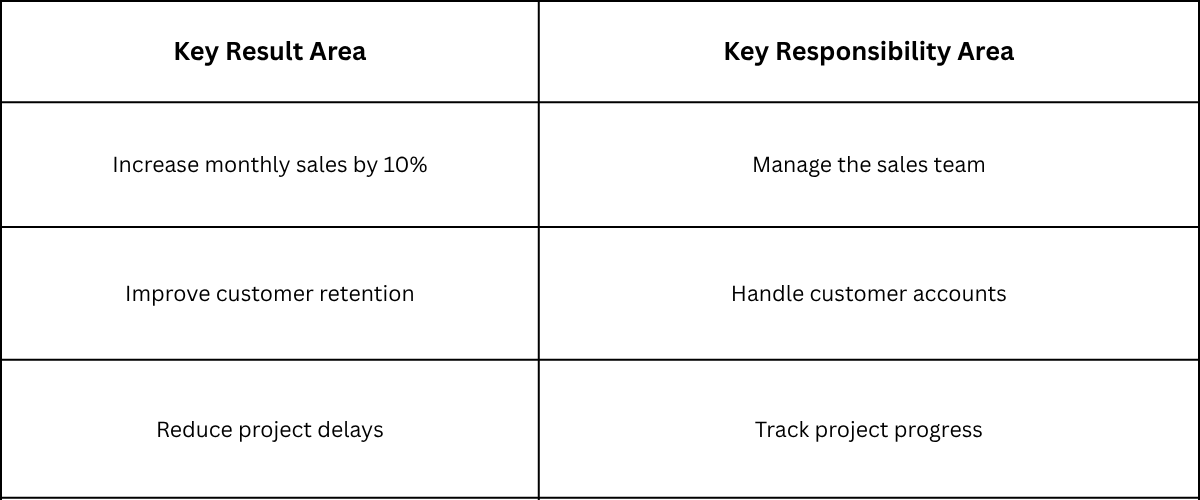
The difference is simple: responsibilities describe what you do, while KRAs describe the results you need to achieve.
Why KRAs Matter in Performance Management
KRAs give performance reviews a clear focus. They help managers and employees agree on the main results expected from a role.
They can help teams:
• Set clear performance goals
• Track progress
• Review employee performance
• Focus on high-value work
• Connect individual goals with team goals
• Find areas that need improvement
How Many KRAs Should a Role Have?
There is no fixed number for every role. The right number depends on the job and its level of responsibility.
For a presentation, 3 to 5 KRAs can be a good starting point. This keeps the slide easy to read and helps the audience focus on the main areas.
KRA vs. KPI vs. OKR
KRA, KPI, and OKR all help teams track work and results, but they serve different purposes.
What Is a KRA?
A Key Result Area (KRA) is a major area where a person or team needs to produce results.
For a marketing manager, KRAs may include:
• Brand awareness
• Lead generation
• Content marketing
• Customer engagement
KRAs give a broad view of the main result areas in a role.
What Is a KPI?
A Key Performance Indicator (KPI) is a measurable value used to track performance.
A lead generation KRA may use KPIs such as:
• Number of qualified leads
• Lead conversion rate
• Cost per lead
• Monthly website leads
KPIs add measurable data to a KRA.
What Is an OKR?
An Objective and Key Results (OKR) framework connects a clear goal with measurable results.
For example:
Objective: Increase qualified leads.
Key Results:
• Generate 500 qualified leads per quarter
• Raise the lead conversion rate from 5% to 8%
• Reduce the cost per qualified lead by 10%
How KRAs, KPIs, and OKRs Work Together
These tools can work together in a performance system:
KRA → KPI → OKR
Example:
• KRA: Lead Generation
• KPI: Qualified leads per month
• OKR: Generate 1,500 qualified leads this quarter
A KRA defines the main area. A KPI measures performance. An OKR sets a specific goal and measurable results.
How to Build a KRA Model
A KRA model gives a role or team a clear set of result areas. Each KRA should have a clear owner, priority, and way to measure results.
Start With Business Goals
Start by listing the main goals the business wants to achieve. These may focus on revenue, customer growth, cost control, product quality, or service.
Select the goals that relate to the role or team you are presenting.
For example, a revenue goal may require stronger sales results, while a customer goal may require better retention.
Connect KRAs to Business Strategy
Each KRA should connect to a business goal or strategic priority.
A simple structure is:
Business Goal → Strategic Priority → KRA → Measure
For example, if the business wants to increase customer retention, a customer service team may have a KRA focused on retention results.
Keep this connection clear on the slide. A simple flowchart can work well.
Define Clear Outcome Areas
A KRA should describe an area where a role or team needs to produce a result. It should not simply list tasks.
For example:
• Task: Complete weekly sales reports
• KRA: Sales Performance
Useful KRA names may include:
• Revenue Growth
• Customer Retention
• Product Quality
• Team Productivity
• Cost Control
Keep each KRA focused so it is easy to measure and review.
Assign KRA Owners
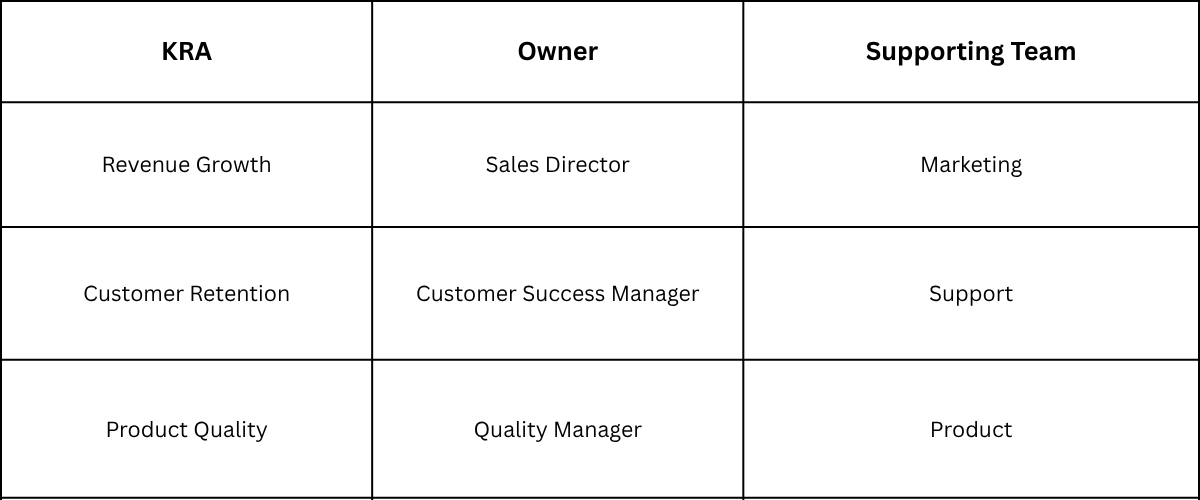
Every KRA needs a clear owner. The owner is the person or team responsible for managing the result area.
For example:
Set KRA Weightings
KRA weightings show the relative priority of each result area. The total should equal 100%.
For example:
• Revenue Growth: 40%
• New Customer Growth: 30%
• Customer Retention: 20%
• Sales Reporting: 10%
Higher weights should go to areas that have a larger effect on key business goals.
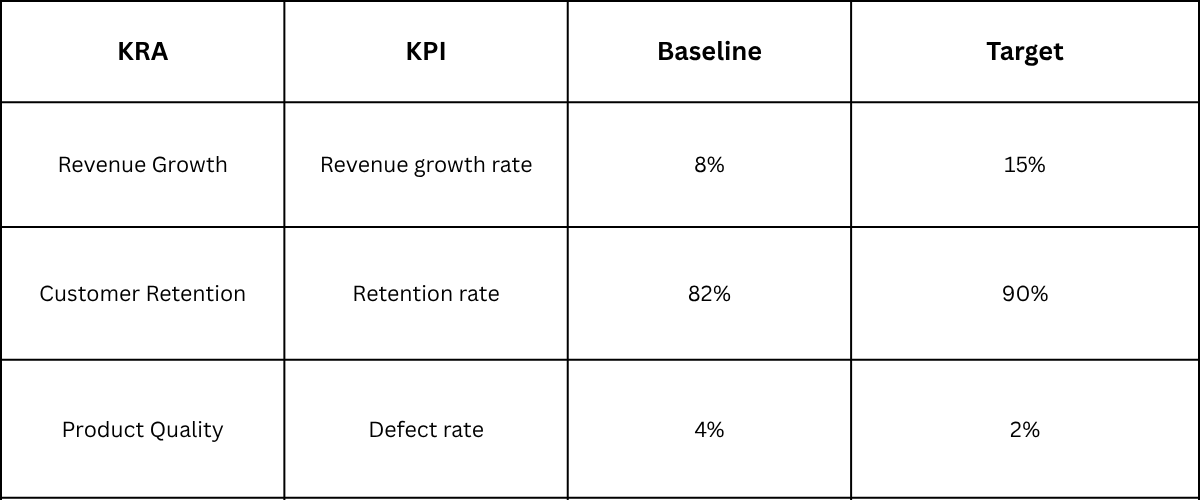
Attach KPIs and Other Measures
Each KRA needs a way to track results. Choose measures that directly relate to the KRA.
How to Structure a KRA Presentation
A KRA presentation should follow a clear order. Start with the business goal, then introduce the KRAs, measures, targets, and results.
Start With the Business Objective
Begin with the main business objective. This gives the audience a reason for the KRAs.
For example, a sales team may have a goal to increase annual revenue. The KRAs can then focus on new sales, customer retention, and account growth.
Show the Link Between Strategy and KRAs
Show how each KRA supports the business strategy.
Use a simple flow:
Business Objective → Strategy → KRA → Measure → Target
A diagram or flowchart can make this relationship easier to understand.
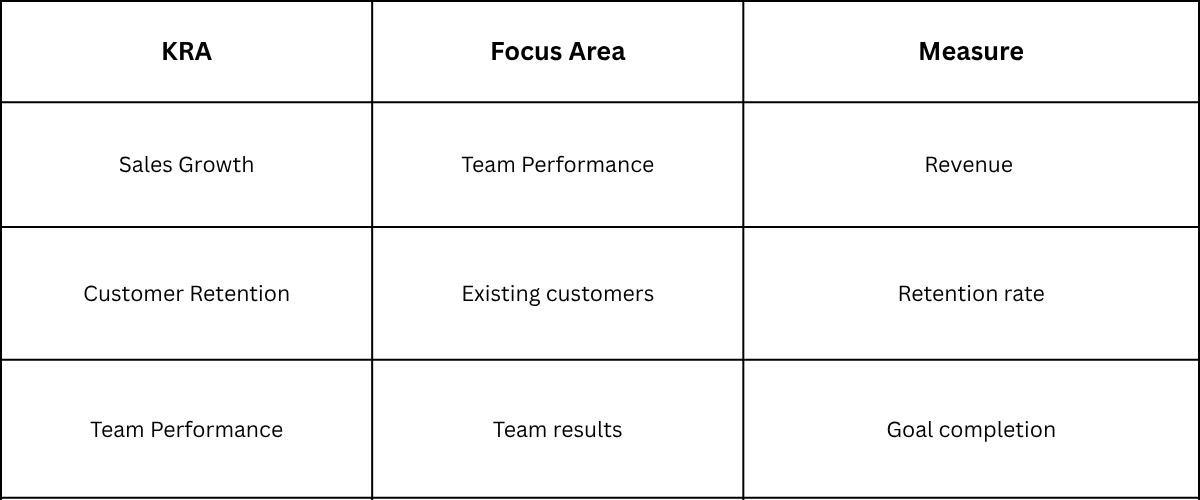
Present the KRA Framework
List the main result areas and what each one covers.
Show KRA Weightings
Show the percentage assigned to each KRA.
For example:
• Sales Growth: 40%
• Customer Retention: 30%
• Team Performance: 20%
• Process Improvement: 10%
A bar chart or stacked bar can make these differences easy to see.
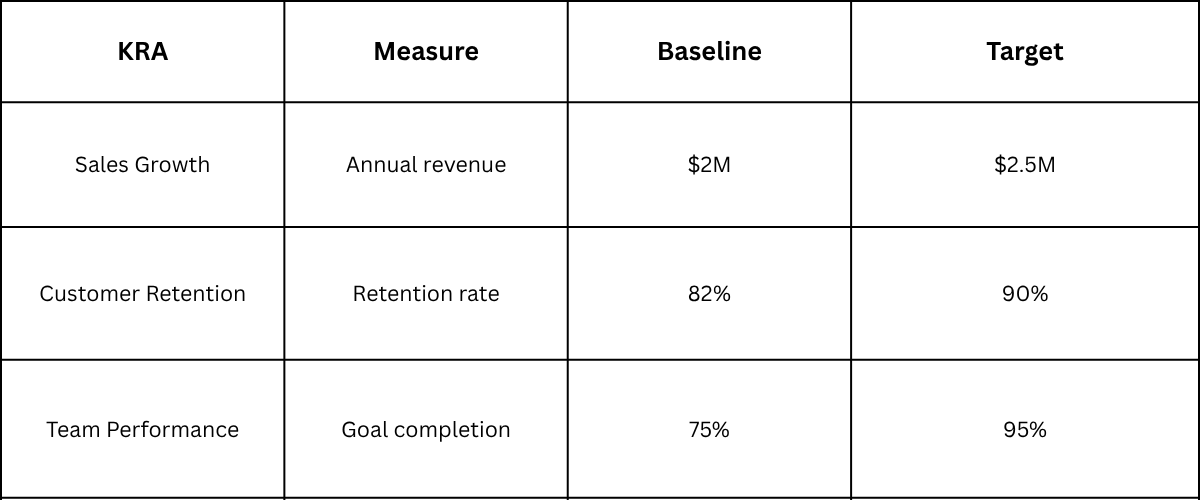
Present Measures, Baselines, and Targets
Give each KRA a clear measure, baseline, and target.
End With Review and Next Steps
Close the presentation with the review process.
Include:
• Review dates
• KRA owners
• Progress tracking method
• Target review process
• Next actions
This gives the audience a clear idea of what happens after the presentation.
How to Present KRA Performance With Data
KRA performance slides should answer a few basic questions:
• What is the KRA?
• How is it measured?
• What was the baseline?
• What was the target?
• What was the actual result?
• What is the gap?
Show the KRA and Its Measure
Start with the KRA name and its measure.
For example:
• KRA: Customer Retention
• Measure: Customer retention rate
• Unit: Percentage
• Review period: Q1
This gives the audience context before showing the numbers.
Compare Baseline and Target
The baseline shows the starting point. The target shows the expected result.

Keep the same unit and time period for both values.
Highlight Actual Performance
Make the actual result one of the most visible items on the slide.
For example:
Actual performance: 82%
The audience can then compare:
• Baseline: 78%
• Target: 85%
• Actual: 82%
A short label can add context:
82% | Below target
Show Variance or Performance Gaps
Show the difference between the actual result and the target.
Target: 85%
Actual: 82%
Gap: 3 percentage points
Do not make the audience calculate the gap. Show it directly.
You can also add a short reason:
3 percentage points below target due to lower renewal rates in Q1.
Use Charts to Make Results Clear
Charts work well for comparisons and trends.
A bar chart can compare baseline, target, and actual results. A line chart works well for results tracked across several periods.
Each chart should have:
• A clear title
• Simple labels
• A visible target
• The actual result
• A useful time period
• A clear unit
Move Detailed Data to an Appendix
The main slide does not need every data point. Keep detailed information in an appendix.
An appendix can include:
• Monthly results
• Supporting measures
• Data sources
• Calculation details
• Team-level results
• Historical performance
This keeps the main presentation focused while giving you extra information for questions.
How to Create a KRA Cascade Slide
A KRA cascade shows how a business goal connects to team and role-level goals.
Start With the Enterprise Goal
Place the main business goal at the top.
For example:
Enterprise Goal: Increase customer retention by 15%
Keep the wording short so the audience can understand it quickly.
Connect Goals to Functions
Show how the main goal connects to business functions.
For example:
• Marketing: Increase customer engagement
• Sales: Improve customer renewal rates
• Customer Support: Reduce customer complaints
• Product: Improve product adoption
Use boxes, lines, or arrows to show the connection.
Connect Functions to Role-Level KRAs
Show how each function connects to specific roles.
For example:
Customer Support Goal: Reduce customer complaints
Support Manager KRA: Improve support response time
Support Agent KRA: Resolve customer issues within the target time
A simple structure is:
Enterprise Goal → Function Goal → Role KRA
Show Accountability With Clear Owners
Add the owner for each KRA.
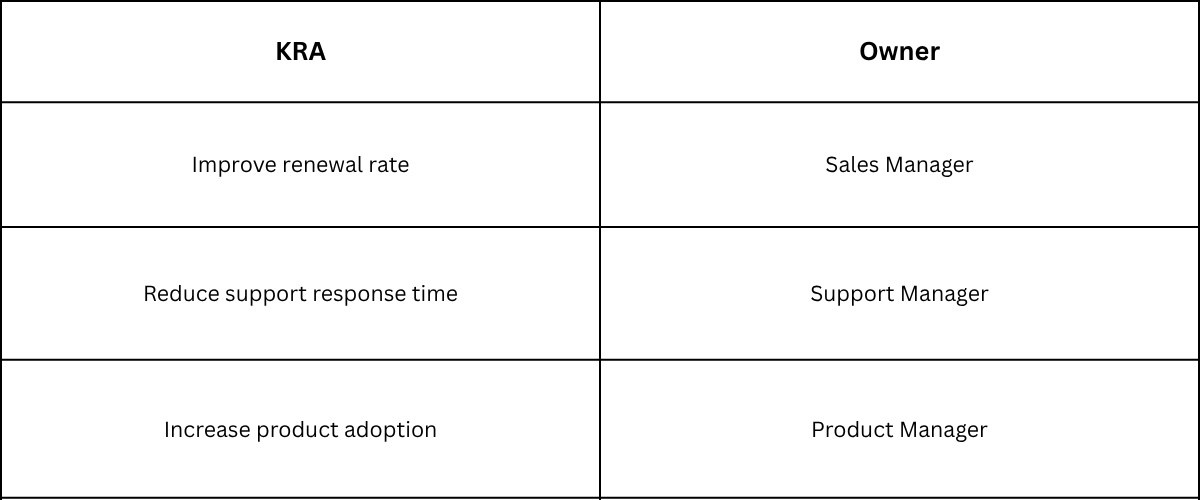
Clear ownership makes accountability easier to understand.
How to Show KRA Weighting in a Presentation
KRA weighting shows how much each result area matters to a role.
Explain Why Each KRA Has a Weight
Show the percentage and give a short reason for the priority.
For example:
• Revenue Growth: 40%
• Customer Retention: 30%
• New Accounts: 30%
The highest weight should reflect the area with the greatest effect on the role's goals.
Use a Stacked Bar Chart
A 100% stacked bar can show how the weights are divided. Add the percentage to each section so the audience can compare the priorities quickly.
Compare Weightings Across Roles
You can also compare KRA priorities across roles. For example, a Sales Manager may have a higher weight for revenue growth, while a Customer Success Manager may place more weight on customer retention.
Use the same scale and layout for each role.
How to Present KRA Results to Executives
Executives need to see what KRA results mean for the business. Focus on outcomes, key numbers, and business impact.
Lead With the Business Problem
Start with the problem or goal the KRA was designed to address.
For example, if the KRA is to increase revenue from existing customers, start with the revenue problem before showing the KRA.
Focus on Outcomes Instead of Activities
Executives care more about results than task lists.
For example:
• Activity: Contacted 200 potential customers
• Outcome: Generated 45 qualified leads
• Business result: Increased new sales opportunities
The outcome gives a clearer view of performance.
Highlight the Most Important Results
Do not put every result on one slide. Focus on the numbers that matter most.
You can show:
• Target
• Actual result
• Achievement rate
• Change from the previous period
• Key business result
Explain Performance Gaps
If actual performance is below the target, show:
- Target: What you planned to achieve
- Actual: What you achieved
- Reason: What caused the gap
Then explain what action will address the issue.
Connect Results to Business Impact
Show why the result matters.
A simple structure is:
KRA → Result → Business Impact
For example, reducing customer response time may improve customer satisfaction, retention, or service costs.
Prepare for Questions About Targets and Ownership
Be ready to explain:
• Why the target was set
• Who owns the KRA
• How the result was measured
• What caused major changes
• What actions come next
• What support is needed
Keep detailed calculations and supporting data in backup slides.
Common Mistakes When Presenting KRAs
Starting With a KRA Definition
For an executive presentation, do not start with a long definition. Start with the business goal or problem. Then introduce the KRAs that support it.
Turning the KRA Slide Into a Job Description
A KRA slide should not list every task in a role.
Instead, focus on outcomes such as:
• Customer Retention: Improve customer renewal rates
• Revenue Growth: Increase sales from key accounts
• Team Development: Build stronger team performance
Overloading the Cascade Slide
Too many boxes, arrows, and labels can make a cascade hard to follow.
Use:
Business Goal → Function Goal → Role KRA → Owner
Move extra details to another slide.
Showing Too Much Performance Data
Avoid turning the slide into a large data table. Focus on:
• Target
• Actual result
• Gap
• Business meaning
Put detailed figures in an appendix.
Hiding KRA Weightings
If all KRAs look equally important, the audience may not understand the role's priorities. Show the weight beside each KRA.
Leaving Out KRA Owners
Every KRA should have a clear owner. This makes accountability easier to understand.
Using Activities Instead of Outcomes
Compare:
Activity: Conduct 20 customer meetings each month
Outcome: Increase customer renewal rate to 90%
The outcome is more useful for a KRA presentation.
Tips for Presenting KRAs Effectively
Keep Each Slide Focused
Give each slide one main idea. Avoid putting several KRAs, long text blocks, and multiple charts on one slide.
Use Clear Visuals
Use charts, tables, icons, or simple shapes to present KRA data. Choose a visual that fits the information.
For example, use a bar chart for comparisons and a table for KRA targets and actual results.
Show Results With Numbers
Use actual values instead of vague statements.
Key figures may include:
• Target
• Actual result
• Percentage achieved
• Variance
• Change from the previous period
Keep Metrics Relevant
Every metric should help explain the KRA. Remove numbers that do not support the main result.
Use Consistent KRA Categories
Keep category names, labels, and measurement methods consistent across related slides. This makes results easier to compare.
Practice Your Presentation
Practice how you will introduce each KRA, explain the result, and answer questions. Do not read every number from the slide. Focus on the points that need spoken context.
Final Notes
A clear KRA presentation helps your audience understand what matters, how success is measured, and who owns each result. Start with the business goal. Connect it to the right KRAs, measures, targets, and owners. Keep each slide focused on one main point. Use simple charts and numbers to show performance.
For executive presentations, focus on outcomes and business impact. Keep detailed data in an appendix. A KRA cascade can also show how company goals connect to teams and individual roles. The goal is simple: make every KRA easy to understand, measure, and discuss.
FAQs
What is a KRA in a presentation?
A KRA, or Key Result Area, is a major area where a person or team is expected to produce results. In a presentation, KRAs show what matters most in a role and how those areas connect to business goals.
How many KRAs should be included in a presentation?
For a presentation, 3 to 5 KRAs can be a good starting point. The right number depends on the role and its main result areas.
What should a KRA presentation include?
A KRA presentation can include the business goal, strategic link, KRA framework, owners, weightings, measures, baselines, targets, actual results, and performance gaps.
How do you present KRA performance?
Start with the KRA and its measure. Then show the baseline, target, actual result, and gap. Use a chart or simple data points to make the result easy to compare.
What is the difference between a KRA and a KPI?
A KRA defines a major result area. A KPI is a measurable value used to track performance in that area.
How do you show KRA weightings on a slide?
Use a table, bar chart, or stacked bar chart. Show the percentage assigned to each KRA. Make sure the total equals 100%.
What is a KRA cascade slide?
A KRA cascade slide shows how an enterprise goal connects to function goals and role-level KRAs. A simple structure is Enterprise Goal → Function Goal → Role KRA → Owner.
How should KRAs be presented to executives?
Start with the business problem or goal. Focus on outcomes instead of activities. Show the most important results, performance gaps, and business impact.
What are common mistakes in a KRA presentation?
Common mistakes include adding too many KRAs, listing job duties instead of results, adding too much data, hiding weightings, leaving out owners, and focusing on activities instead of outcomes.
How can you make a KRA presentation easier to understand?
Keep each slide focused on one main idea. Use clear visuals and relevant metrics. Show targets, actual results, and gaps. Keep labels and KRA categories consistent.
Should detailed KRA data be included on the main slides?
No. Main slides should show the data needed to understand the result. Detailed results, calculations, supporting measures, and historical data can go into an appendix.
How do KRAs, KPIs, and OKRs work together?
A KRA defines the main result area. A KPI measures performance in that area. An OKR sets a specific objective and measurable key results for a set period.




You may also be interested in ...

Tips To Create A Great Infographic
Infographics Have been around for a while, but not many people know about them or are their preferred presentation choice. If...
08 Jun, 2024

3 Steps To Create The Best Presentation...
Presentations are something wonderful when well done, you can captivate an audience or be super interested in what another pe...
23 Jun, 2024

3 Tips For Your Next Presentation You MU...
PowerPoint presentations are perfect for explaining a topic and communicating your ideas with a visual aid. But most people s...
08 Jun, 2024