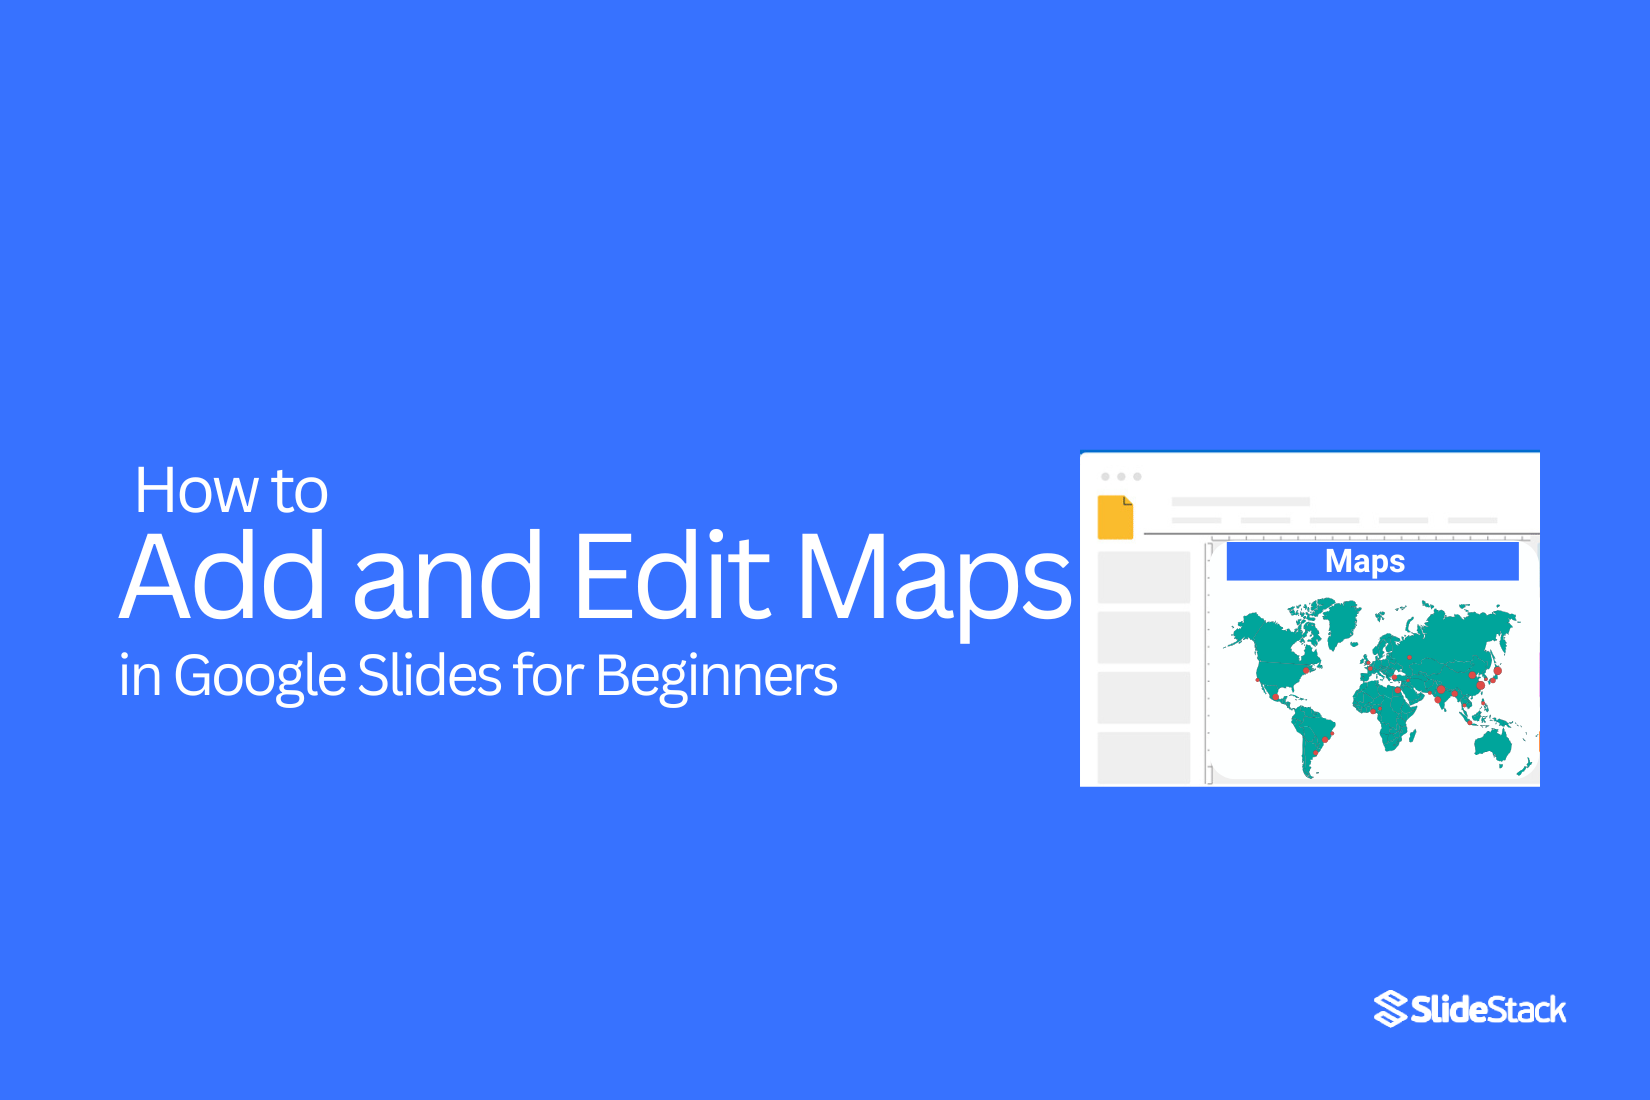
How to Add and Edit Maps in Google Slides for Beginners
Google Slides is a useful tool for building clear and engaging presentations. It offers many features that help explain ideas in a simple way. One helpful feature is the ability to add maps. Maps help show locations, explain movement, and give meaning to data that depends on place.
Maps also help viewers follow your message with less effort. A well-edited map can guide attention and support your points without extra text. This makes slides easier to understand and more effective.
In this tutorial, you will learn how to add and edit maps in Google Slides. The guide covers colors, text, icons, and layout. Each step is explained in a clear and simple way, making it easy for beginners to follow and apply.
When and Why Use Map Infographics
Map infographics show data linked to places. They combine visuals with location details. This helps people spot patterns across areas. The message stays clear and easy to read.
Maps fit many topics. They show sales by region. They explain travel paths. They show service areas. They also support social and environmental topics. Any story tied to a place can use a map.
The value becomes clear at work.
In business, map infographics share insights fast. A sales team can show results by state. A logistics team can show delivery zones. Leaders scan the slide and get the point. The slide says more with fewer words.
Classrooms gain from this, too.
Teachers use maps for geography lessons. History classes show events across regions. Science lessons show climate or population data. Students stay focused because the data feels real and visual.
Why choose a map instead of a chart?
Key advantages
• Data feels easier to understand
• Location patterns stand out right away
• Slides support quick decisions
• Visuals hold attention longer
• Topics work at the local or global scale
Maps also help recall. People remember visuals better than lists. A clean map can stay in mind after the lesson or meeting ends.
Pro tip
SlideStack map infographic templates save time and keep slides consistent. They are easy to edit and ready for school or work decks. Use them to share location data with clarity and ease.
Benefits of Using Maps in Google Slides
Maps can make your Google Slides presentations clearer and more engaging. They help your audience understand information quickly and see relationships that words alone might not show. Using maps adds value in several practical ways.
VisualizationMaps turn complex information into clear visuals. Your audience can see patterns, trends, or locations at a glance. This makes it easier to compare data across regions without reading long lists or tables.
Context
Maps give your presentation context. Showing where events, resources, or statistics occur helps your audience understand why the information matters. Context makes your points easier to follow and remember.
Interactivity
Interactive maps let your audience explore information. You can zoom in on areas, highlight specific regions, or link to extra details. Interactivity keeps your presentation engaging and allows viewers to focus on what interests them most.
Customization
Maps can be adapted to fit your content. You can choose colors, labels, and markers that match your slides and highlight key points. Customization ensures your maps support your message clearly and visually.
Using maps in Google Slides strengthens your presentation. They make information easier to see, understand, and interact with. Whether you are showing data trends, project locations, or regional comparisons, maps help your audience grasp your points quickly and effectively.
How to add a Map in Google Slides
Google Slides allows you to add a map directly to your slides.
Step 1: Open your Google Slides presentation and go to the slide where you want the map.
Step 2: Copy the map you want from Google Maps or another source.
Step 3: Paste the map into your slide.
How to change the color of a Map in Google Slides?
Changing the colors of a map in Google Slides can make your presentation clearer and more visually engaging. Adjusting colors helps highlight key regions, show differences, and guide your audience’s attention. A well-colored map can turn a basic slide into a more effective visual tool.
Step 1: Select the map
Click on the map on your slide. Make sure the entire map is highlighted so your changes will apply correctly.
Step 2: Open the format options
Go to the menu and click on “Format options.” Look for the section that controls color or fill. This will let you change the colors for individual regions or the entire map.
Step 3: Apply new colors
Choose a region or the whole map and select a new color from the palette. Repeat for other areas if needed. Check that the colors contrast well so each part of the map stands out clearly.
How to add and change the text on the map in Google Slides?
Adding text to a map in Google Slides helps make your presentation clearer. You can highlight locations, label areas, or provide extra context for your audience. Text boxes also let you combine visuals and words, making your map more interactive and easier to understand.
How to Add or Edit Text on a Map
Step 1: Insert a Text Box
Select the “Text Box” tool from the toolbar. Click anywhere on your map where you want to place your text.
Step 2: Enter Your Text
Type the content you want. Keep it short and relevant to the map location. You may now adjust the font size, color, or style to make it stand out.
Step 3: Move or Resize the Text Box
Click and drag the text box to place it exactly where it fits best. Use the handles on the corners to resize if needed.
Optional: Add Hyperlinks for More Interaction
Adding links to your map can help viewers access more information directly from your slides.
Step 1: Select the Text
Click on the text you want to link. Highlight it.
Step 2: Insert a Link
Right-click and choose “Link,” or use the shortcut Ctrl+K (Cmd+K on Mac). Paste the URL you want your text to open.
Step 3: Test the Link
Click “Apply,” then present your slide to make sure the link works as expected.
Adding text and links on maps is simple, but it can make your presentation much more engaging. Labels and links guide your audience and keep the focus on key points.
How to Add and Change Map Icons
Icons on a map help people see key points quickly. They show locations, landmarks, or categories at a glance. Using clear icons makes your map easier to read and more useful.
Step 1: Locate the Icon
First, choose the icon you want to use. You can find built-in icons in your mapping software or upload your own. Pick an icon that clearly represents the place or item.
Step 2: Copy and Paste the Icon
Once you have the icon, copy it. Then, paste it onto the map where you want it to appear. You can add as many icons as you need, one by one.
Step 3: Move the Icon
Click and drag the icon to the exact spot on the map. You can adjust it until it lines up with the location perfectly.
Step 4: Change the Icon Color
To make icons stand out, select the icon and use the Fill option to change its color. Choose a color that matches your map’s theme and helps users quickly identify categories.
Optional Tip: Use Multiple Icons with a Legend
If you have different types of locations, use several icons and create a small legend. This shows viewers what each icon represents without adding text clutter.
Caution
Try not to include too much text near the icons. Overloading the map with words can make it confusing. Keep it simple so your icons remain the main focus.
Wrapping It Up
Maps in Google Slides make presentations stronger and easier to follow. They turn numbers and locations into visuals that everyone can understand. Adding colors, labels, and links helps highlight key points and keeps viewers engaged. Whether for work or school, maps guide attention and support your message. By using these tools, your slides become clearer, more organized, and more effective at showing the story behind the data.
FAQs:
1. Can I add a map directly to Google Slides?
Yes. You can copy a map from Google Maps or another source and paste it into your slide.
2. How do I change the colors on a map?
Select the map, open “Format options,” and adjust the colors for regions or the whole map. Choose contrasting colors so all areas are easy to see.
3. Can I add text to a map?
Yes. Use the “Text Box” tool to place labels, notes, or titles on the map. You can move and resize the text boxes as needed.
4. Is it possible to add links to a map?
Yes. Highlight the text, right-click, choose “Link,” and paste the URL. Test it in presentation mode to make sure it works.
5. Why should I use a map instead of a chart?
Maps show location patterns clearly, make data easier to understand, and help your audience remember information. They work well for local or global data.
6. Can maps be used for both work and school?
Absolutely. Businesses use them for sales, logistics, and project locations. Teachers use them for geography, history, or science lessons.
7. Are there templates I can use for maps?
Yes. SlideStack offers map infographic templates that are ready to edit. They save time and keep your slides consistent.


You may also be interested in ...

How To Create An Eye-Catching Portfolio
If you’re looking to create an eye-catching portfolio, this post will come in handy. In this article, you can find the easies...
23 Jun, 2024

How To Easily Create An Infographic
Infographics are the perfect way to make a presentation that will impact an audience, but their design and composition might...
08 Jun, 2024

PowerPoint Template Tips & Tricks You Ne...
PowerPoint seems to be an unknown world for many people, especially those who have been assigned to create a presentation out...
08 Jun, 2024