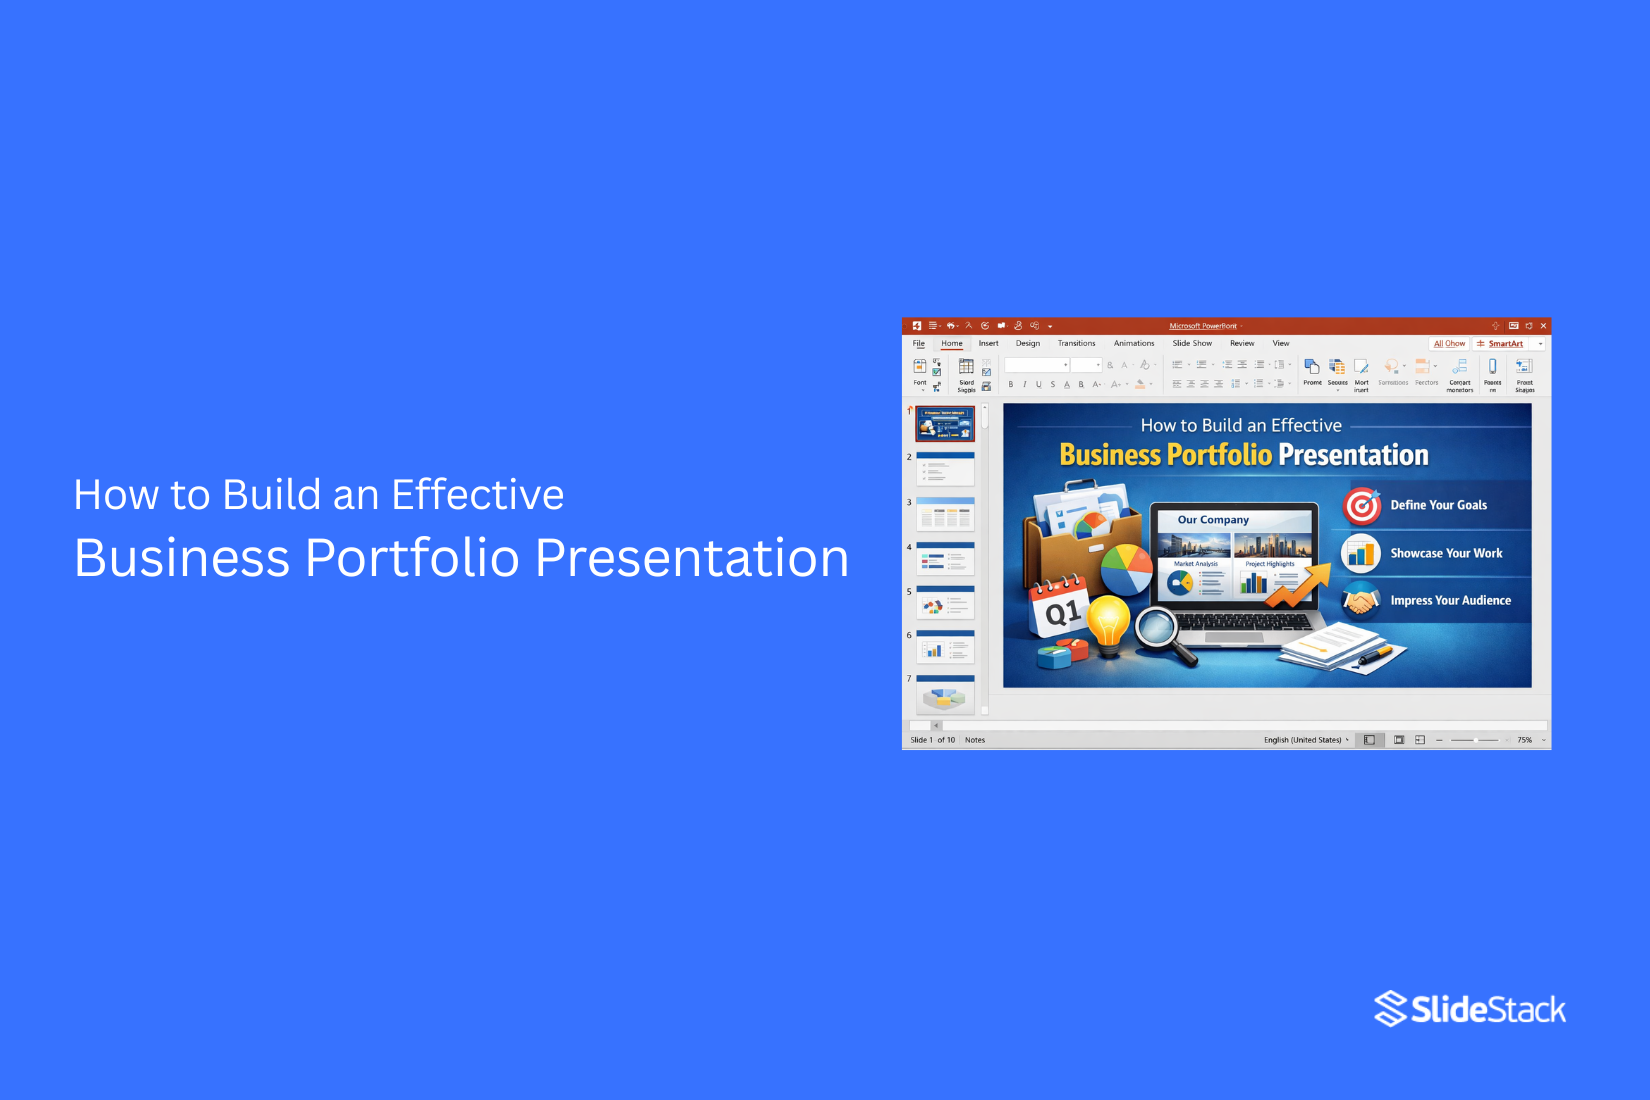
How to Build an Effective Business Portfolio Presentation
Many business portfolio presentations fail to show real value. They look crowded, unclear, and hard to follow. A strong portfolio presentation should clearly show what a business owns, delivers, and plans. It helps leaders and clients understand value and direction without confusion. This guide shows how to structure a portfolio presentation step by step. Next, how to structure a portfolio step by step and build a clear business impact. It also highlights key elements like structure, clarity, and decision-making value. A well-built presentation helps attract trust and supports stronger business decisions. You will learn how to build slides that communicate portfolio strength with clarity. Follow the steps ahead to create a clear and effective business portfolio presentation. It improves communication and decision speed.
What a Business Portfolio Presentation Really Does
A business portfolio presentation explains what a business owns, runs, and delivers. It shows each part of the business and how those parts work together. The goal is not simple reporting. The goal is a clear understanding of structure and purpose. Weak practice focuses on listing items. It reads like a catalog of activities, products, or teams. Strong practice explains the meaning behind each part. It shows why each unit exists and how it supports the wider direction. One approach only shows data. The other shows direction and intent.
A strong presentation starts with a clear purpose. Every section connects back to that purpose. This removes confusion about why the portfolio exists. It sets a clear standard for what success looks like across the business. Risk communication sits inside the structure. A good portfolio does not hide pressure points. It shows them in a clear way. This builds trust in decision-making. It also helps leaders see where attention is needed before issues grow.
Time matters in portfolio thinking. Some parts of the business work for short-term outcomes. Others focus on longer results. A strong presentation separates these time layers. It helps leaders judge performance in the right context instead of mixing different horizons.
Each part of a portfolio also connects with others. One unit can support growth in another. One weakness can affect several areas at once. A systems view shows these links clearly. This helps leaders avoid isolated decisions that miss wider effects. A business portfolio presentation works best as a single connected story. Each part supports the next. The full structure gives clarity on direction, risk, time, and connection.
Selecting and Categorizing Portfolio Components
A business portfolio can hold many activities. A presentation cannot show all of them. Only a limited number of items can sit in the main story. The rest belongs in supporting material. This limits the space available and forces a clear choice. Focus becomes stronger through this constraint.
The selection process starts with clear roles inside the business. Some parts bring in most of the revenue. Some support daily operations. Some protect long-term stability or meet regulatory needs. Each part serves a different purpose. The main narrative should include only the components that shape direction, performance, or resource decisions. Other items remain in backup detail to avoid distraction.
Clear grouping improves how the portfolio is understood. Components can be placed into sets based on shared function or market role. Product lines, customer segments, and performance levels are common ways to form these sets. The value lies in the logic behind the grouping. A structure without clear reasoning creates confusion. A structure built on business logic helps the audience follow the system with less effort.
Large portfolios often contain parts that do not match in size or maturity. Some parts are stable and generate steady returns. Others are early-stage and carry more uncertainty. A shared set of review measures helps bring order to this mix. Measures such as revenue contribution, customer reach, and risk level give a consistent way to compare different components. This creates a clearer view across the full portfolio.
Slides to Include in a Business Portfolio Presentation Deck
A business portfolio deck uses a small set of slide types. Each slide has one job. Too many slides weaken the message. The story becomes harder to follow. Too few slides push the audience to fill gaps on their own.
The slides below form a complete structure:
• Portfolio Overview / Context Slide: Defines scope, time range, and the method used to assess parts of the portfolio.
• Portfolio Performance Overview: Compares main segments using shared measures such as revenue, growth, and output.
• Situation Analysis Slide: Shows current position, stable areas, pressure points, and early signals across the portfolio.
• Strategic Resource Allocation Slide: Shows how money, time, and staff are split across segments and why those choices exist.
• Portfolio Risk Management Slide: Shows risk types, level of exposure, and actions tied to each area of the portfolio.
• Execution Roadmap / Timeline: Places initiatives across time and shows order, sequence, and links between workstreams.
• Strategic Rationale Slide: Explains how the portfolio is structured, along with limits and trade-offs behind key choices.
• Decision and Next Steps Slide: Shows decisions needed from leadership and the actions that follow each choice.
Together, these slides turn a set of activities into a structured portfolio view that leaders can review, compare, and act on with less friction.
Building a Narrative in Business Portfolio Presentations
Narrative in a business portfolio presentation is not persuasion. It is ordering information for executive reasoning. It sets how the audience reads position, limits, and impact. The goal is a clear interpretation without extra explanation. A common flow starts with the current state. This shows where the organization stands today. Next comes value distribution. This explains where output and return sit across units. Risk follows. This section shows pressure points and exposure. Decisions come last. This part shows direction and required action. This order reduces confusion and keeps reading steady.
Another way to shape the narrative comes from audience questions. The audience looks for a position. They look for sources of value. They look for weak points. They look for the next action. Each section can respond to one of these points. This keeps meaning direct and easy to track. Transitions connect each section. A shift in topic needs a clear link in logic. The audience should understand why the focus is changing. A brief explanation of the relation between sections keeps attention stable. This avoids breaks in understanding and supports continuous reading across the portfolio.
Designing Business Portfolio Slides for Comparability
Business portfolio slides work best when they support a clear comparison across many units. The goal is not visual decoration. The goal is accurate reading of differences and relationships. Each slide becomes a small part of a larger decision system. Weak design breaks that system and creates confusion in interpretation.
Uniform structure sits at the center of effective portfolio design. Every slide should follow the same layout pattern. Titles stay in the same position. Metrics appear in the same order. Charts follow the same placement rules. This repetition allows the audience to read each slide without re-learning the format. Mixed layouts force extra effort and slow down comparison across units.
Consistency also reduces mental load during review. The viewer does not need to adjust attention for each slide. Instead, focus stays on the data itself. Repeated structure creates a stable reading path. That stability supports faster comparison between business segments. Inconsistent formatting interrupts that flow and weakens clarity.
Scale control is another key requirement. Charts must use consistent axis rules across all portfolio components. Different scales change how performance appears. A strong trend on one slide can look weak on another due to axis differences. This creates a distortion in judgment. Shared scale rules keep interpretation aligned and protect trust in the data.
Color use needs strict control across the full deck. Each category or business unit should have a fixed color assignment. That color should not change across slides. Shifting meanings across colors breaks orientation. The viewer loses the ability to track categories quickly. A stable color system supports faster recognition and cleaner comparison.
Information load on each slide must stay limited. Each component should show only the key metrics needed for comparison. Too many charts or tables reduce clarity. The main deck should stay focused on core signals such as performance level, trend direction, and contribution. Deeper detail belongs in supporting material rather than the main view.
A clear separation between main slides and backup analysis keeps the presentation usable. The main deck supports quick understanding and decision-making. Backup slides hold detailed breakdowns for deeper review. This structure keeps the main narrative clean while still allowing depth where needed.
Presenting Risk, Value, and Timing Across a Business Portfolio
A portfolio presentation often breaks down when performance data stands alone. Numbers get shared, but meaning stays unclear. Decision makers are left to interpret direction without a shared frame. Three lenses bring structure to that gap: value, risk, and timing. Each one answers a different question. Together, they define how a portfolio should be read.
Value goes beyond revenue. Revenue shows output, but not role. Some parts of a portfolio create entry into new markets. Some strengthen their position with existing customers. Others shape partnerships or open ecosystem access. A strong portfolio view separates these functions instead of treating everything as an equal contribution. Without that separation, high revenue items can mask low strategic contribution.
Risk often gets reduced to a caution note. That weakens the message. Risk signals where performance may shift under pressure. It includes market exposure, execution limits, dependency on external partners, and regulatory sensitivity. Many presenters avoid detail here, which creates doubt instead of clarity. Clear risk framing does the opposite. It shows control. It shows awareness of weak points and how they are managed. Balance across the portfolio also plays a role. High exposure in one area can be offset by stability in another. That structure matters more than isolated risk labels.
Timing defines when outcomes take shape. Some initiatives deliver now. Others build value over a longer horizon. Grouping everything into a single timeline distorts expectations. Mature areas behave differently from expansion efforts. Pilot work carries uncertainty but sets direction. Early-stage work explores options without guaranteed return. Separating these stages allows performance to be judged fairly, based on where each activity sits in its lifecycle. A portfolio becomes readable when these three lenses are applied together. Value explains purpose. Risk shows exposure. Timing sets expectations. Without all three, interpretation drifts, and decisions lose precision.
Strategic Rationale and Decision Logic
Strategic rationale is a structured answer to a focused question. Why this structure, now? It connects portfolio design to the constraints that shape real choices. It explains why certain components exist, why others do not, and why the current balance has been set in this way. This is not a vision. Vision describes direction. It is not a retrospective justification. It does not defend past actions after outcomes are known. Strategic rationale sits in the middle. It links intent, constraints, and allocation decisions into one clear line of reasoning.
A portfolio structure does not form in isolation. It is shaped by limits that cannot be ignored. Budget defines scale. Talent defines execution capacity. Technology sets boundaries on speed and feasibility. Competition influences urgency and positioning. These factors do not sit outside the decision. They define it.
Within those limits, decisions take a clear form. Investment areas receive resources because they align with priority outcomes. Non-investment areas are not random exclusions. They represent deliberate omission. Each omission signals a choice about where not to compete or expand. This separation between investment and non-investment creates the core logic of portfolio design.
Clear evaluation criteria must exist before interpretation begins. Without them, decisions appear inconsistent or subjective. Criteria such as growth potential, strategic fit, operational readiness, and risk exposure define how each component is assessed. These standards set the frame for judgment before any portfolio element is reviewed. Sharing these criteria early changes how the structure is understood. It removes guesswork. It allows each decision to be traced back to a known rule set. The audience no longer interprets results in isolation. They evaluate them against a defined system of logic.
Constraints shape allocation in direct ways. A limited budget forces prioritization. Scarce talent requires focus on areas with the highest return on capability. Technology gaps restrict what can be scaled. Competitive pressure forces trade-offs between speed and depth. Each constraint narrows the field of possible decisions until only a few viable paths remain. Some portfolio elements remain because of legacy. Not all legacy components reflect the current value. Some persist due to historical structure rather than present relevance. A disciplined review separates useful continuity from inertia-driven persistence. This distinction prevents outdated elements from quietly shaping future direction.
Portfolio design is not static. It shifts as new information enters the system. Feedback from performance, market signals, and execution outcomes informs adjustments. Each cycle of learning refines allocation logic and sharpens prioritization rules. Over time, the structure becomes more aligned with actual performance drivers. Anticipating questions is part of the discipline. Weaknesses in reasoning often appear as gaps in explanation rather than flaws in decision-making. Addressing those gaps early reduces misinterpretation. It also strengthens the clarity of the logic behind each allocation choice.
Managing Audience Expectations and Challenging Questions
Senior audiences act as evaluators of both content and reasoning. They do not focus only on slides. They assess how the portfolio is structured. They also assess how decisions are formed. Preparation goes beyond presentation material.
Strong presenters hold clear answers before questions appear. They know the logic behind each portfolio choice. They also stay ready to explain trade-offs without hesitation. Three core dimensions shape evaluation. Impact sits at the center. Risk exposure sits beside it. Resource return sits alongside both. These dimensions guide how decisions are judged across business units.
Questions rarely stay at the surface. They test system-level understanding. Single asset explanations are not enough. The focus shifts to how each part connects to the whole structure. Preparation includes identifying weaker areas in advance. Low-performance zones draw more attention. High-risk segments also receive deeper review. These areas require clear reasoning and stable justification.
Credibility comes from readiness to explain each portfolio decision. Every allocation choice needs a clear reason. Every underperforming unit needs a clear position. Silence or hesitation reduces trust in the structure. A second expectation sits on decision clarity. Senior groups look for firm direction on resources. Expansion signals must be clear. Maintenance positions must be justified. Exit positions must be direct and grounded in logic.
Challenging questions test control under pressure. Composure remains steady. Key points are stated without reaction. Context is set using portfolio structure rather than personal defense. The focus stays on logic, not emotion. Authority grows through alignment between answers and portfolio design. Each response reinforces the structure. Each explanation returns to the same foundation of decisions and trade-offs.
Visual Frameworks for Structuring Portfolio Information
Business portfolio information can become hard to follow without structure. Visual frameworks solve this problem by organizing data into clear patterns. A simple grid layout helps separate business units. Each box holds one unit. Revenue, growth, and risk sit inside the same space. This keeps comparisons direct and clear.
Another useful structure is a layered map. The top layer shows core business units. The middle layer shows support units. The bottom layer shows experimental or early-stage units. This layout shows how each part connects to the bigger system.
Bar charts help show performance differences. Each bar represents one unit. Length shows scale. This makes strong and weak areas easy to see without extra explanation. Flow diagrams show movement between units. Arrows connect one part of the portfolio to another. This helps explain how value moves across the business.
Color can also support clarity. One color can represent growth areas. Another can show stable units. A third can mark risk areas. This removes confusion in dense information sets. Clear spacing matters as well. Crowded visuals reduce understanding. Empty space gives each unit room to stand out. A strong portfolio presentation uses these frameworks together. Each one adds a different layer of clarity.
Industry-Specific Business Portfolio Structures
A business portfolio does not look the same across industries. Each industry has its own priorities. Each one also has its own way of measuring value. A strong portfolio reflects that difference. A tech company often centers its portfolio around product lines, user growth, and release cycles. The focus stays on speed of delivery and adoption rates. Product updates and version history help show direction and momentum.
A healthcare portfolio shifts the focus. Patient outcomes, compliance standards, and service coverage take priority. Each unit in the portfolio must show reliability and safety. Numbers linked to care quality matter more than rapid change. Manufacturing portfolios highlight production capacity and efficiency. Output levels, defect rates, and supply chain stability take center stage. Each segment of the portfolio often links back to cost control and throughput.
Financial services portfolios tend to group offerings by risk level and revenue type. Credit products, investment services, and insurance lines are often shown side by side. The structure helps decision makers see balance across risk and return. Retail portfolios usually follow customer segments and product categories. Sales volume, margins, and regional performance guide the layout. Seasonal shifts also shape how the portfolio is arranged across time.
Each industry also shapes how comparisons are made. A single metric rarely tells the full story. Decision makers look across multiple indicators to understand performance patterns. A clear structure helps remove confusion. It also makes weak points easier to see. Strong portfolios do not hide differences. They organize them in a way that supports clear decisions.
Managing Audience Expectations and Handling Questions
Business portfolio presentations often go in front of senior leaders. These meetings focus on decisions, not decoration. Every slide sets a level of expectation. Clarity matters from the start. The audience wants to know what the portfolio covers and why it matters. If that is unclear, questions become harder to manage later. Strong presenters set the direction early. They define what is included in the portfolio and what is not. This helps shape how the audience reads the rest of the content.
Questions often focus on three areas. Performance, risk, and resource use. Leaders look for proof behind each point. They also check for gaps in logic or missing details. A calm tone during questions helps keep control of the room. Short answers work better than long explanations. Each response should stay close to the point being asked.
Some questions repeat across different slides. That usually signals a deeper concern. It helps to listen for patterns instead of treating each question alone. A useful approach is to link answers back to the structure of the portfolio. This keeps the discussion aligned with the original message instead of drifting into side topics. The strongest presentations do not avoid difficult questions. They handle them with direct answers and steady logic.
Common Mistakes in Business Portfolio Presentations
Many portfolio presentations fail before the discussion even starts. The problem often lies in how information is chosen and shown. Small choices in structure can change how leaders judge the whole story. One common issue is too much detail. Slides get crowded with numbers, charts, and notes. The audience loses focus. The main message becomes hard to follow. A clear portfolio view should show only what supports decisions.
Another mistake is unclear grouping. Projects or units appear without a clear order. Strong and weak areas sit side by side with no logic. This makes comparison difficult. Decision makers struggle to see patterns in performance or value. Inconsistent visuals also create problems. Different formats, colors, and metrics appear across slides. This forces the audience to reset their thinking each time. A unified structure keeps attention on meaning, not design changes.
Some presentations also avoid risk discussion. Only positive results are shown. Weak areas are hidden or softened. Senior leaders notice this quickly. They expect a balance between performance and risk. Missing that balance reduces trust in the message. There is also the issue of weak hierarchy. Everything looks equally important. Nothing stands out. The audience does not know where to focus first. A strong portfolio view always guides attention to the most critical points first.
Another frequent gap is a lack of comparison. Items are shown one by one without context. Without a side-by-side structure, it becomes hard to judge trade-offs. Portfolio thinking depends on comparison, not isolation. These mistakes often come from trying to include too much or trying to present everything as equally important. A clearer structure solves most of these problems and makes decision-making faster and more direct.
Best Practices for High-Impact Business Portfolio Slides
Strong portfolio slides help leaders compare business areas with ease. Clear structure supports faster reading of information. Poor structure slows review and creates confusion across the deck. Each slide should carry one clear message. Too many ideas on a single slide reduce focus. A single point keeps attention steady and improves understanding during discussion.
Consistency across slides supports comparison. The same layout for every unit helps viewers scan without effort. Changing formats between slides breaks the flow and makes the comparison harder. Metrics need the same definition and placement across all sections. A shared format for revenue, cost, and growth avoids misreading. Different formats for similar data create doubt during review.
Charts should stay simple and direct. One chart should show one pattern. Extra visuals around the chart reduce clarity. Clean data presentation supports quicker decisions. Text should stay short. Long explanations take focus away from numbers. Labels that state what the data shows are enough.
Alignment plays a key role in readability. Even spacing between elements makes slides easier to scan. Misaligned items draw attention away from the message. Color use should stay limited. A small set of colors helps separate categories without distraction. Too many colors make patterns harder to follow. Strong portfolio slides rely on structure, clarity, and repeatable design rules. These elements guide the viewer through the information without friction.
FAQs
What is the objective of a business portfolio presentation?
A business portfolio presentation shows how a set of projects, products, or services works together. It explains value creation at a system level. It also shows how resources are allocated and what trade-offs exist between options. Decision-makers use it to judge direction, balance, and performance quality.
How much detail should each portfolio component include?
Each component should show only what supports a decision. Key metrics, role in the portfolio, and current status matter most. Extra details that do not affect judgment should stay out. Strong portfolios separate signal from noise by focusing on facts tied to performance or direction.
What is the best sequence for presenting portfolio elements?
Start with core assets that generate steady value. Move next to growth areas that expand scale or reach. End with emerging areas that carry higher uncertainty. This order matches how decision-makers process risk and return across a portfolio.
How should underperforming parts of a portfolio be handled?
Weak performance should be shown directly with a clear context. The focus should stay on what is driving the issue. That includes market shifts, execution gaps, or resource limits. The response should also state what action is planned to correct or manage the gap.
What design approach works best for portfolio slides?
Each section should follow a consistent structure. This helps comparison across units. Layouts should stay stable so attention stays on data, not design changes. Visual consistency supports clearer judgment and faster evaluation.
How should time be used in portfolio evaluation?
Time should be grouped by stages, such as early, mid, and mature phases. This helps explain why performance differs across units. It also prevents unfair comparisons between assets at different levels of development.
What role does storytelling play in a portfolio presentation?
Storytelling should not add decoration. It should explain the structure. Each part of the portfolio should connect through logic that shows how value is created and sustained. The focus stays on clarity of relationships, not narrative style.
How should projections be presented?
Projections must link to clear assumptions. Each forecast should show what conditions are required for it to happen. This keeps expectations grounded and makes risks visible. Unsupported projections reduce trust in the overall portfolio view.
How should executives prepare for questions on portfolio slides?
Preparation should focus on gaps, risks, and allocation choices. Each slide should be reviewed for weak points that may trigger scrutiny. Clear responses should explain why decisions were made and how they align with overall portfolio goals.
How should coherence be maintained across the presentation?
Every section should connect back to the same system logic. Each asset, metric, and decision must support the overall portfolio direction. Without this link, the presentation becomes fragmented and harder to evaluate.
Final Words
A portfolio presentation shows analytical ability. It shows how clearly ideas are structured. It shows how facts are organized and presented in order. The presenter does more than repeat data. The focus shifts toward explaining links between ideas. Each point connects to a decision. Each decision shows reasoning behind it. The message becomes clearer through this approach.
Portfolio outcomes also reflect how resources are used. Some parts show present needs. Other parts show future needs. The balance between these two areas becomes visible. Flexibility appears through changes in direction and adjustment of plans. Strong results come from a clear selection of content.
Grouping of information stays consistent and simple. Design choices stay clean and direct. Each section needs a clear reasoning behind it. Uncertainty also needs careful handling through steady explanation. A portfolio presentation moves beyond reporting. It becomes a clear view of structured thinking. It shows how decisions are formed. It shows how information supports direction.


You may also be interested in ...

How To Create An Eye-Catching Portfolio
If you’re looking to create an eye-catching portfolio, this post will come in handy. In this article, you can find the easies...
23 Jun, 2024

How To Easily Create An Infographic
Infographics are the perfect way to make a presentation that will impact an audience, but their design and composition might...
08 Jun, 2024

PowerPoint Template Tips & Tricks You Ne...
PowerPoint seems to be an unknown world for many people, especially those who have been assigned to create a presentation out...
08 Jun, 2024