How to Use Gap Analysis to Improve Business Performance
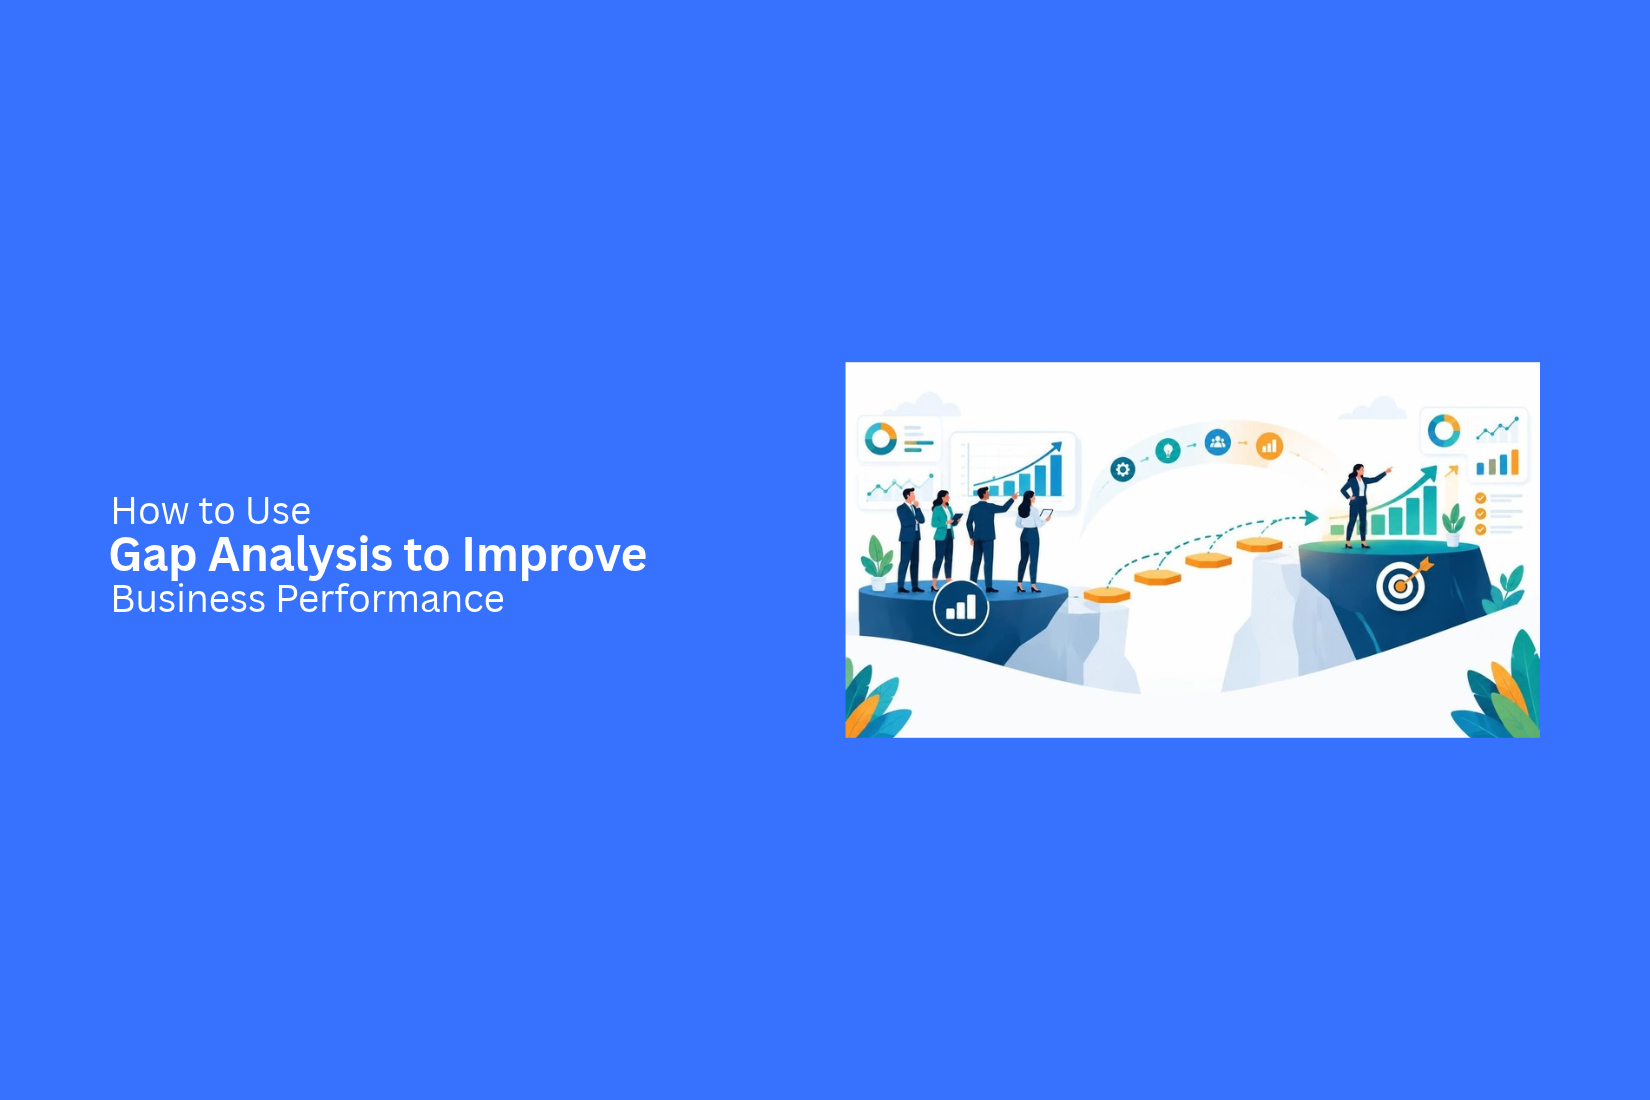
Every business has goals, but reaching them is not always easy. A company may fall behind its targets, face low team performance, or fail to get the results it expects. Without a clear view of these problems, it can be hard to know what needs to change.
Gap analysis helps businesses find the difference between their current performance and their desired results. It also helps identify the reasons behind these gaps and plan ways to close them.
In this article, you'll learn how to use gap analysis to improve business performance. We'll cover its types, key steps, useful tools, and ways to present results. You'll also learn common mistakes to avoid and best practices to follow.
What Is Gap Analysis?
Gap analysis is a method businesses use to compare their current performance with their desired results. It helps identify the difference between where a business is now and where it wants to be. This difference is called a gap.
For example, a company may want to reach $100,000 in monthly sales. However, its current sales are only $70,000. The gap is $30,000. The company can use gap analysis to find the reasons behind this difference and plan ways to improve its sales.
Gap analysis can help businesses review their goals, processes, resources, and results. It also helps teams spot areas that need improvement. By understanding these gaps, businesses can make better plans, use resources wisely, and improve overall performance.
Why Is Gap Analysis Important for Business Performance?
Every business has goals. However, actual results may not always match those goals. This can affect growth, sales, team output, and daily work. Gap analysis helps businesses find the reasons behind these gaps. It gives managers a clear view of current performance. They can compare actual results with expected results. This makes it easier to spot areas that need attention.
Here are some key reasons why gap analysis matters for business performance:
1. Finds Performance Gaps: It shows the difference between current results and business goals. Teams can see where they fall short.
2. Helps Set Clear Goals: Businesses can use the findings to set clear and realistic targets. This gives teams a better sense of direction.
3. Improves Resource Use: Gap analysis helps managers see where time, money, and staff are needed most. They can use these resources more wisely.
4. Supports Better Decisions: Managers can use facts from the analysis to make better choices. This reduces guesswork and helps them focus on the right areas.
5. Tracks Business Progress: Regular gap analysis helps teams check their progress. They can see if their actions are working or need changes.
6. Improves Team Performance: It helps managers find skill gaps, work delays, and process issues. They can then plan the right steps to improve team output.
Types of Gap Analysis for Businesses
Businesses face different types of gaps. Some relate to team performance. Others involve employee skills, products, or market needs. Each type of gap analysis helps a business find a specific problem. It also helps teams decide where to focus their efforts.
Here are five common types of gap analysis used by businesses.
Performance Gap Analysis
Performance gap analysis compares current business results with expected results. It helps a company see where its performance falls short of its goals.
For example, a sales team may have a monthly target of $50,000. However, its actual sales may reach only $40,000. This creates a $10,000 gap.
The team can review its sales process, customer service, and staff performance. This helps managers find the cause of the gap. They can then plan steps to improve results.
Skills Gap Analysis
Skills gap analysis looks at the difference between the skills employees have and the skills their jobs require. A company may need staff with strong data analysis skills. Its current team may lack enough training in this area. This can slow down work and affect results. Managers can use this analysis to find missing skills across their teams. They can then plan training sessions, offer staff development, or hire people with the skills they need.
Market Gap Analysis
Market gap analysis helps a business find needs that are not being met by current products or services. It looks at customer needs, market demand, and existing offers.
For example, customers may want affordable software for small businesses. However, most available options may be too costly. This creates a gap in the market.
A company can study customer feedback and market trends to find these gaps. This helps it spot new business opportunities and plan products or services that meet customer needs.
Product Gap Analysis
Product gap analysis compares a company's current products with customer needs and expectations. It helps teams find missing features, product issues, or areas that need improvement.
For example, a software company may offer a project management tool. Customers may ask for a feature that allows them to track team workloads. If the product does not offer this feature, there is a gap between the product and customer needs. The company can use customer feedback and product reviews to find these gaps. This helps its team decide which features to add or improve.
Strategic Gap Analysis
Strategic gap analysis compares a company's current position with its long-term business goals. It helps leaders see whether their current plans can deliver the results they want.
For example, a company may aim to grow its annual revenue by 30%. Its current business plan may only support 15% growth. This shows a gap between its goal and its expected results.
Leaders can review their business plans, resources, and growth targets. They can then make changes to close the gap and keep the company on track.
How to Conduct a Gap Analysis to Improve Business Performance
A gap analysis helps you find the difference between your current business results and your goals. It also helps you understand what needs to change. The process starts with clear goals and ends with a plan to improve results. Follow these steps to conduct a gap analysis for your business.
Define Your Business Goals
Start by setting clear business goals. These goals give your team a target to work toward. They also help you decide which areas need attention. Your goals should be specific and easy to measure. For example, a business may want to increase sales by 20% in the next six months. Another may aim to reduce customer complaints by 15% within one year. Write down each goal. Add a deadline and a way to measure success. This will help you compare your current results with your desired results.
Measure Current Business Performance
Next, review your current business performance. Gather data from the areas linked to your goals. This gives you a clear view of where your business stands today.
You can review several key areas, such as:
• Sales: Check total revenue, monthly sales, and the number of new customers.
• Customer service: Review customer feedback, complaints, and response times.
• Marketing: Measure website traffic, leads, and campaign results.
• Operations: Check work speed, costs, and team output.
• Employee performance: Review staff output, attendance, and task completion.
Use recent and accurate data for this step. Your findings will serve as the starting point for the gap analysis. Keep all results in one place so your team can review them with ease.
Identify the Gaps Between Current and Desired Results
Now compare your current results with your business goals. The difference between these two figures shows where your business falls short.
For example, your sales goal may be $100,000 per month. Your current monthly sales may be $80,000. This means your business has a $20,000 sales gap.
You can use a simple table to list each goal, current result, desired result, and gap.
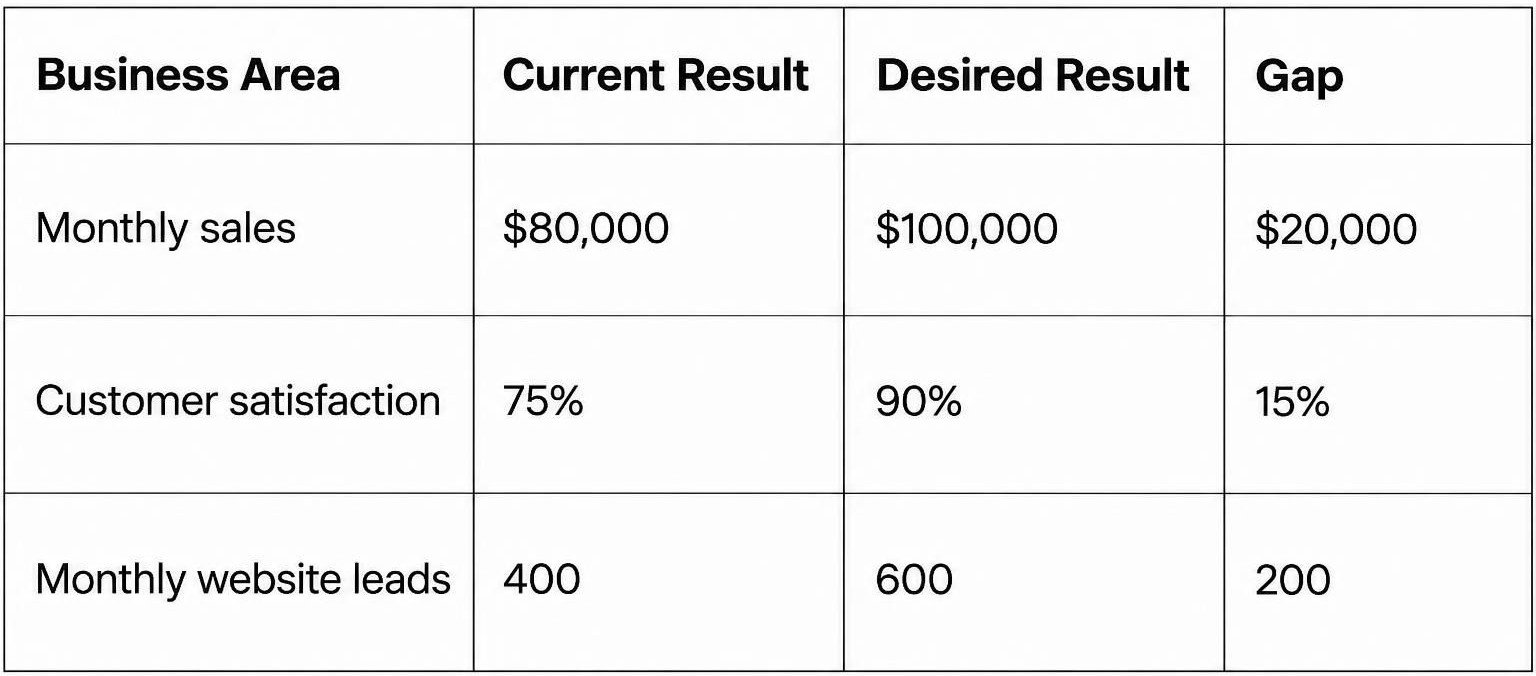
This table makes it easier to see which areas need attention. It also helps your team set priorities. Start with the gaps that have the greatest effect on business goals.
Find the Root Causes of Each Gap
Finding a gap is only part of the process. You also need to understand why it exists. A business may have low sales, but the cause may not be poor marketing. It could be weak customer service, high prices, or a lack of product options.
Review each gap and ask questions to find its main cause.
For example, low website traffic may be linked to weak content, poor search visibility, or limited promotion. Low employee output may result from a lack of training, unclear tasks, or poor team communication.
Talk with employees and review business data. Gather feedback from people who work in each area. This can help you find the actual cause instead of making decisions based on guesses.
Create an Action Plan to Close the Gaps
Once you know the causes, create an action plan. This plan should list the steps your business will take to reach its goals.
A good action plan should include:
• Key tasks: List the steps needed to address each gap.
• Team members: Assign each task to a person or team.
• Deadlines: Set a clear date for each task.
• Resources: List the tools, budget, and support needed.
• Success measures: Choose how you will track each task.
For example, a business with low sales may train its sales team, review its pricing, or improve its marketing efforts. Each task should have a clear owner and deadline. Break large tasks into smaller steps. This makes the work easier to manage. It also helps your team stay focused on the main goals.
Track Progress and Measure Results
An action plan needs regular checks. Track each task to see if your team is making progress. Compare new results with the starting data from your gap analysis.
Use key performance indicators (KPIs) to measure changes. These may include sales growth, customer satisfaction, website leads, or employee output.
Set a regular review schedule. You can check progress each week or month. Use these reviews to see which actions are working and which need changes.
For example, a business may aim to increase monthly sales from $80,000 to $100,000. After three months, sales may reach $90,000. This shows progress, but the business still has a $10,000 gap to close.
Keep tracking the results until your business reaches its goals. Review the action plan as needed. New data may show that some tasks need more time or a different approach.
Common Tools and Frameworks for Gap Analysis
A gap analysis helps a business find the difference between its current results and its goals. Several tools can make this process easier. Each tool looks at a different part of the business. Some focus on internal issues, while others help compare results or find the cause of a problem.
Here are five useful tools for gap analysis.
SWOT Analysis
SWOT analysis helps a business review its current position. It looks at four areas: strengths, weaknesses, opportunities, and threats.
• Strengths: These are the things your business does well. They may include skilled staff, strong customer service, or good products.
• Weaknesses: These are areas that need work. Examples include high costs, poor communication, or slow work processes.
• Opportunities: These are outside factors that may help the business grow. They can include new markets or changes in customer needs.
• Threats: These are outside factors that may affect business results. Examples include new competitors, rising costs, or changes in demand.
A SWOT analysis helps teams understand their current position. It also shows where improvements are needed. A business can use these findings to set clear goals and create an action plan.
McKinsey 7S Framework
The McKinsey 7S Framework helps a business review seven key parts of its operations. These parts must work well together to support business goals.
The seven elements are:
• Strategy: The plan a business follows to reach its goals.
• Structure: How teams, roles, and departments are organized.
• Systems: The daily processes and tools used to complete work.
• Shared Values: The main beliefs and values that guide the company.
• Style: The way leaders manage teams and make decisions.
• Staff: The people who work for the business.
• Skills: The abilities and knowledge employees bring to their roles.
A business can use this framework to find gaps between its plans and daily work. For example, a company may have a clear growth plan but lack the right skills or team structure. The 7S Framework helps show these gaps. Managers can then decide which areas need attention.
Fishbone Diagram
A Fishbone Diagram helps teams find the main causes of a problem. It is also known as a cause-and-effect diagram.
The problem appears at the head of the diagram. Lines branch out from the main line like fish bones. Each branch shows a possible cause. Teams can add smaller branches to list more details.
For example, a business may face delays in product delivery. The team can use a Fishbone Diagram to review possible causes, such as:
• Staff shortages
• Poor work processes
• Equipment problems
• Supply delays
• Lack of training
This tool helps teams look beyond the visible problem. It gives them a clear view of the issues that may affect business performance. Teams can then focus on the root causes instead of fixing only the symptoms.
Gap Analysis Matrix
A Gap Analysis Matrix helps teams compare current results with target results. It puts key details into a simple table. This makes it easier to see where the business falls short.
A basic matrix may include these columns:
• Business Area: The department or process being reviewed.
• Current State: The results the business has now.
• Desired State: The results the business wants to reach.
• Gap: The difference between current and target results.
• Action Plan: The steps needed to close the gap.
For example, a sales team may want to increase its monthly revenue from $50,000 to $70,000. The gap is $20,000. The team can list actions such as improving sales training, reaching more customers, or reviewing its sales process.
This matrix keeps the findings clear and organized. It also helps managers assign tasks, track progress, and check results over time.
Benchmarking
Benchmarking helps a business compare its results with those of other companies or industry standards. It gives teams a clear point of reference for reviewing their performance.
A business can compare several areas, such as:
• Product quality
• Customer service
• Operating costs
• Sales results
• Employee productivity
• Delivery time
For example, a company may find that its average order delivery time is five days. Its main competitors may deliver orders within three days. This difference shows an area that needs attention.
Benchmarking helps businesses set realistic targets. It also shows where their current results fall short of other businesses. Teams can use these findings to review their work processes and plan specific improvements.
How to Present Gap Analysis Results
A gap analysis is useful only if people understand the results. Your presentation should show the difference between current performance and desired goals. It should also explain what needs to change. Use clear charts, simple comparisons, and action plans to help your audience follow the results. Each slide should focus on one key point. This makes it easier for managers and team members to understand the gaps and decide what to do next.
Use a Gap Analysis Chart to Compare Performance
A gap analysis chart helps your audience compare current results with business goals. It shows where performance meets expectations and where improvements are needed.
Use a simple chart to display key areas, such as sales, customer service, team output, or revenue. Add separate columns for current performance and target performance. You can also use different colors to mark areas with large gaps.
Keep the chart easy to read. Add clear labels and short notes. This helps your audience spot the areas that need attention.
Show Current and Desired Performance
Your audience needs to see where the business stands and where it wants to be. Show both values side by side. This makes the performance gap easier to understand.
For example, a sales team may have a monthly target of $50,000 but only reach $35,000. Show both figures in your presentation. Then highlight the $15,000 gap.
Use charts, tables, or simple graphs to show these differences. Add a short explanation of each result. This gives your audience a clear view of the work needed to reach the target.
Highlight Key Findings and Priority Areas
A gap analysis may reveal several areas that need attention. Your presentation should focus on the findings that have the greatest effect on business performance.
Group the results by importance. Use colors or labels to mark high-priority areas. Add short notes to explain why each gap needs attention.
For example, low sales, high operating costs, and poor customer service may appear in the results. Your team can rank these issues based on their effect on business goals. This helps managers focus on the areas that need action first.
Present Action Plans and Expected Outcomes
After showing the gaps, explain how the business plans to address them. An action plan connects each problem with a clear step.
Use a table to present the main details:
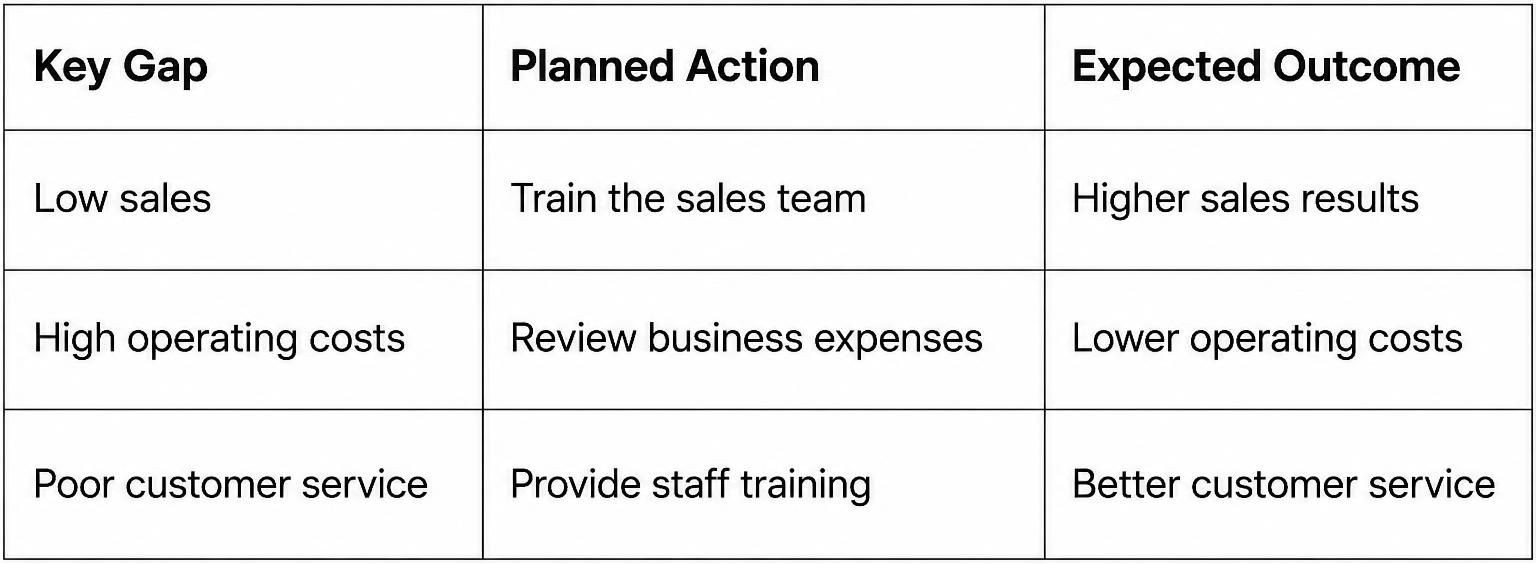
Add a timeline and assign responsibility for each task. This helps team members understand their roles. It also gives managers a way to track progress. End this section with the results the business expects to achieve. Keep each goal clear and easy to measure. This helps your audience understand how the action plan can improve business performance.
Common Mistakes to Avoid in Gap Analysis
Gap analysis helps businesses find areas that need improvement. However, small mistakes can lead to poor results. A clear goal, accurate data, and a realistic action plan are all needed. Here are five common mistakes to avoid during the process.
Setting Unclear Business Goals
Every gap analysis needs clear business goals. Vague goals make it hard to measure performance. They also make it difficult to find the right areas for improvement.
For example, a goal like "increase sales" does not give the team a clear target. A better goal is to "increase monthly sales by 15% within six months." This gives everyone a clear result to work toward.
Set goals that are specific and easy to measure. Make sure each goal supports the company's wider business plans.
Using Inaccurate or Outdated Data
Good decisions depend on reliable data. Old or incorrect data can give a false view of business performance. As a result, teams may focus on the wrong problems.
For example, a company may use last year's sales data to review its current performance. This data may not reflect recent changes in customer demand or sales trends.
Use recent and accurate data for your analysis. Check the source of each report. Review key figures before making decisions. This helps the team get a clear view of the current performance gap.
Ignoring the Root Causes of Performance Gaps
Finding a performance gap is only the first step. The next step is to understand why it exists. Some teams focus only on visible problems. They may miss the main reasons behind poor results.
For example, a drop in sales may seem like a marketing problem. However, the real cause could be poor customer service, product quality, or slow order delivery.
Look beyond the visible results. Ask questions to find the main cause of each gap. This helps the team choose actions that address the real problem.
Creating Unrealistic Action Plans
An action plan should match the company's budget, time, and available resources. Unrealistic plans can put extra pressure on employees. They may also delay progress.
For example, a small business may plan to launch three new products in one month. However, its team may not have enough staff or money to complete the work.
Set clear deadlines for each task. Assign responsibilities based on team capacity. Break large tasks into smaller steps. This makes the plan easier to follow and manage.
Failing to Track Progress
A gap analysis does not end after the action plan is ready. Teams need to track progress to see if their actions are working. Without regular reviews, small problems can go unnoticed.
For example, a business may set a goal to reduce customer complaints by 20%. The team must review complaint reports over time to measure the results.
Set a regular review schedule. Track key performance indicators (KPIs) and compare the results with your original goals. Make changes to the action plan if the results fall short of expectations. This keeps the team focused on its targets and helps measure business improvement.
Best Practices for Effective Gap Analysis
A good gap analysis needs clear goals, accurate data, and input from the right people. A few simple practices can help you get better results. They also make it easier to turn your findings into useful actions.
Use Clear and Measurable Performance Metrics
Start by choosing clear performance metrics. These metrics help you measure the gap between current results and business goals. Use numbers that show real progress.
For example, a sales team may track monthly revenue, new customers, or sales growth. A customer service team may track response time, customer complaints, or satisfaction scores.
Keep your metrics simple and easy to track. This helps your team measure progress and see if the planned changes are working.
Involve Key Team Members
Gap analysis works better with input from people who know the daily work. Team members can point out issues that may not appear in reports. They can also share ideas to improve current processes.
Involve managers, team leaders, and staff from the areas you want to review. Ask them to share their views on current results and possible causes of poor performance. Their feedback gives you a clearer view of the gaps. It also helps the team understand the changes and take part in the action plan.
Focus on High-Priority Gaps
Not every gap needs the same level of attention. Some issues have a greater effect on business results than others. Start with the gaps that cause the most harm or block progress toward your goals.
For example, a company may find gaps in sales, customer service, and staff training. Poor sales may have the greatest effect on revenue. In that case, the company should address the sales gap first.
Rank each gap based on its effect, cost, and urgency. This helps your team use time and resources on the issues that need the most attention.
Review and Update Your Analysis Regularly
Business needs and goals can change over time. A gap analysis should not be a one-time task. Review it on a regular schedule to check your progress. Compare current results with your original metrics. Check which actions have worked and which gaps still need attention. Update your action plan based on the latest results. Regular reviews help your team stay on track. They also make it easier to respond to new business needs and keep performance goals up to date.
Final Notes
Gap analysis helps businesses compare current results with their goals. It shows where performance falls short and what needs to change. By following a clear process, teams can find the main causes of these gaps and create action plans to address them.
Keep these points in mind:
• Set clear and measurable business goals.
• Use recent and accurate data.
• Find the root causes of performance gaps.
• Focus on the areas that have the greatest effect on business results.
• Assign tasks, deadlines, and responsibilities.
• Track progress with key performance indicators (KPIs).
• Review and update your action plan regularly.
A well-planned gap analysis gives your team a clear path to better business results. Use it as a regular part of your business planning process.
FAQs
1. What is the main purpose of gap analysis in business?
The main purpose of gap analysis is to compare current business performance with desired goals. It helps businesses find areas that need improvement and plan steps to close those gaps.
2. What are the five types of gap analysis?
The five common types are performance gap analysis, skills gap analysis, market gap analysis, product gap analysis, and strategic gap analysis. Each type focuses on a different area of business performance.
3. How do you conduct a gap analysis?
Follow these steps to conduct a gap analysis:
- Define your business goals.
- Measure current performance.
- Identify the gaps.
- Find the root causes.
- Create an action plan.
- Track progress and measure results.
4. What tools are used for gap analysis?
Common tools include SWOT analysis, the McKinsey 7S Framework, Fishbone Diagram, Gap Analysis Matrix, and Benchmarking. These tools help businesses review performance, find problems, and plan improvements.
5. How does gap analysis improve business performance?
Gap analysis helps businesses find weak areas, set clear goals, and use resources wisely. It also supports better decisions and helps teams track their progress.
6. How often should a business conduct gap analysis?
A business should review its gap analysis regularly. Weekly or monthly reviews can help teams track progress. They can also update their action plans based on new results.
7. What is the difference between current state and desired state in gap analysis?
The current state shows the business's existing performance. The desired state shows the results it wants to achieve. The difference between these two states is the performance gap.



You may also be interested in ...

Tips To Create A Great Infographic
Infographics Have been around for a while, but not many people know about them or are their preferred presentation choice. If...
08 Jun, 2024

3 Steps To Create The Best Presentation...
Presentations are something wonderful when well done, you can captivate an audience or be super interested in what another pe...
23 Jun, 2024

3 Tips For Your Next Presentation You MU...
PowerPoint presentations are perfect for explaining a topic and communicating your ideas with a visual aid. But most people s...
08 Jun, 2024