How to Create Box Plot Charts in Presentations
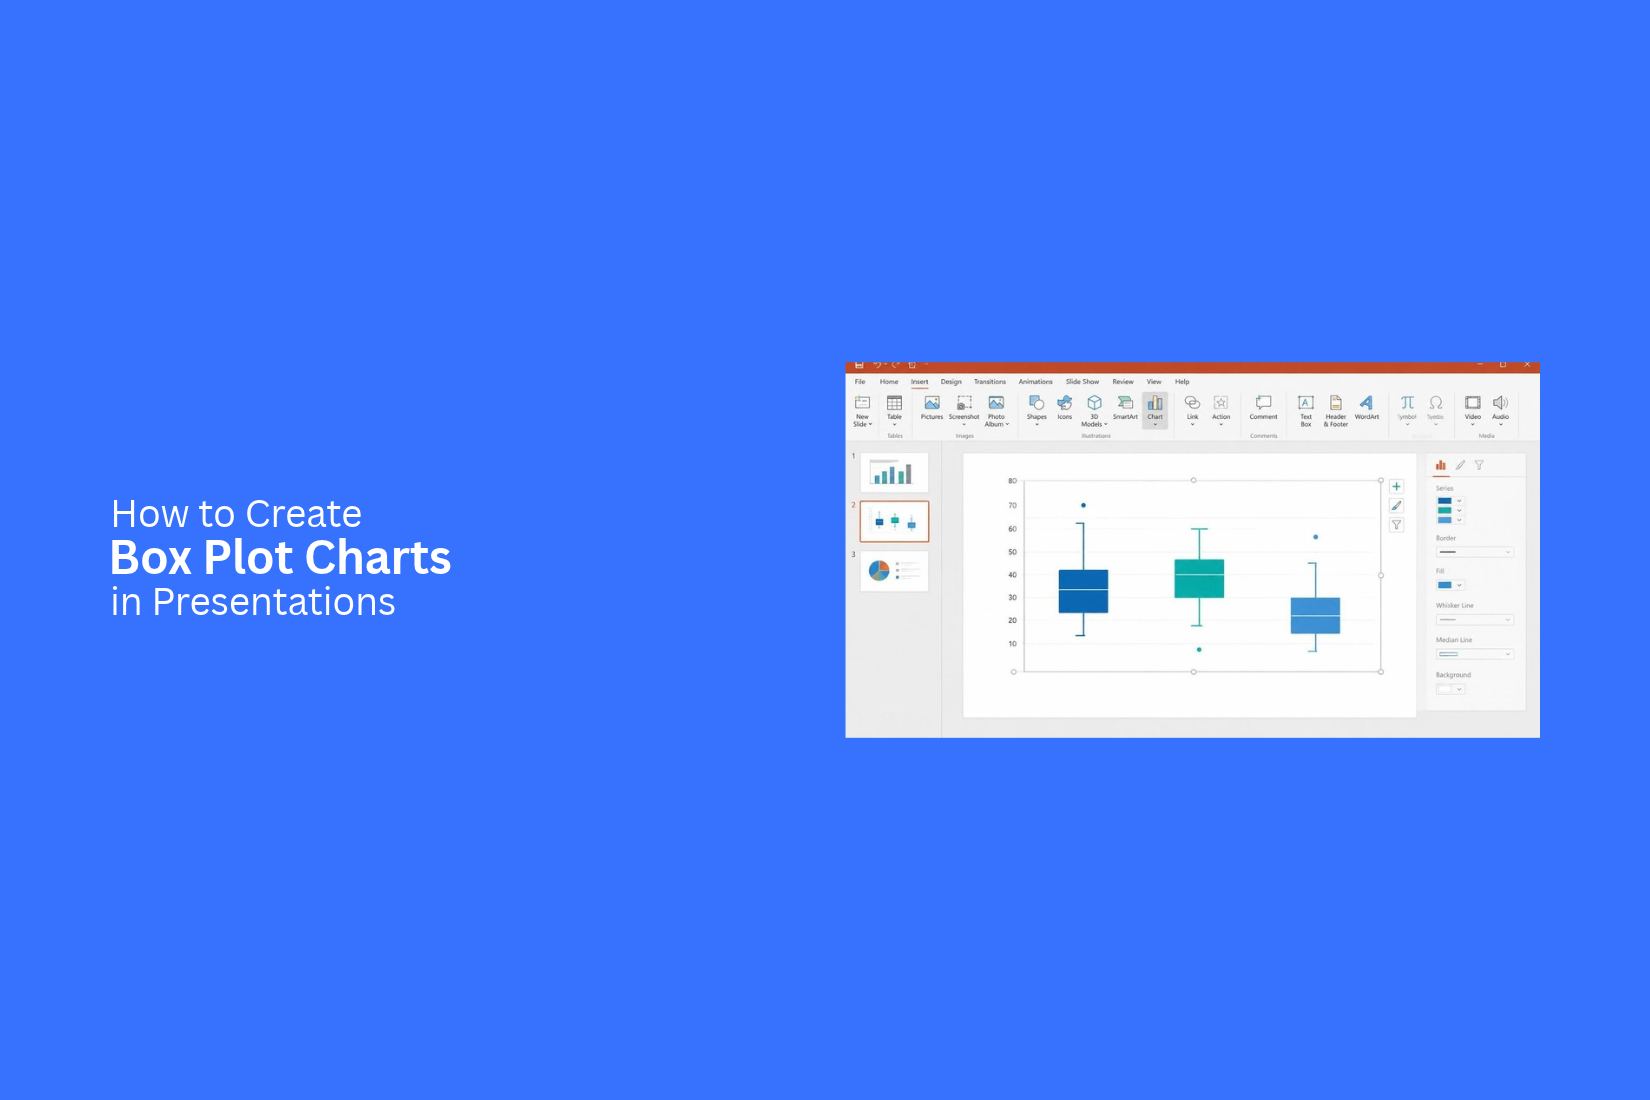
Presenting data in a clear way can be hard. Tables and long lists of numbers may not show how values are spread across a group. Your audience may find it hard to compare results, spot patterns, or understand key differences. This can make your slides less clear and harder to follow.
A box plot chart offers a simple way to present data distribution. It shows the median, quartiles, minimum and maximum values, and outliers in one visual. This helps your audience compare data groups with less effort.
In this article, you'll learn what a box plot chart is, how its key elements work, and how to create and customize one for your presentations. You'll also learn design tips and common mistakes to avoid.
What Is a Box Plot Chart?
A box plot chart is a visual tool used to show how a set of data is spread out. It displays the middle values, the lowest and highest values, and any data points that fall far from the rest. This chart uses a box and lines to show the range of values.
The box shows the middle 50% of the data. A line inside the box marks the median, which is the middle value. The lines that extend from the box are called whiskers. They show the lower and upper ends of the data range, excluding outliers.
Box plot charts help viewers compare data groups and spot differences in their spread. They also make it easier to see whether values are close together or spread far apart. In presentations, you can use them to explain test scores, sales results, survey data, or other sets of numbers.
Why Use Box Plot Charts in Presentations?
Box plot charts help you show how data is spread across a group. They display the median, upper and lower values, and the range of the data. This makes it easier to compare different data sets on one slide.
A box plot also helps your audience spot patterns and unusual values. For example, you can use it to compare test scores from different classes or sales results from several teams. The chart shows how close or far apart the values are.
Here are a few reasons to use box plot charts in presentations:
• Show data spread: Help your audience see how values are spread across a data set.
• Compare groups: Place several box plots side by side to compare different groups.
• Show the median: Highlight the middle value without listing every data point.
• Spot unusual values: Make values that fall far from the rest of the data easier to notice.
• Save slide space: Present key data details in a compact chart instead of a long table.
Key Elements of a Box Plot Chart
A box plot chart has several parts. Each part shows a different point in a data set. Together, they help readers see the spread of values, the middle point, and any values that stand far from the rest.
Minimum and Maximum Values
The minimum and maximum values show the lowest and highest data points in a set. They mark the two ends of the data range. The minimum value is the smallest number. The maximum value is the largest number. These values help readers see how far the data spreads.
First and Third Quartiles
Quartiles divide a data set into four equal parts. The first quartile (Q1) marks the point below which 25% of the data falls. The third quartile (Q3) marks the point below which 75% of the data falls.
These two values form the left and right edges of the box in a horizontal box plot. They show where the middle 50% of the data lies.
Median Line
The median is the middle value in a sorted data set. It divides the data into two equal groups. Half of the values fall below it, and half fall above it. In a box plot, a line inside the box marks the median. This line helps readers see the center of the data at a glance.
Interquartile Range (IQR)
The interquartile range (IQR) shows the spread of the middle 50% of the data. It is the difference between the third and first quartiles.
IQR = Q3 - Q1
A larger IQR means the middle values have a wider spread. A smaller IQR means they are closer together. The box in a box plot represents this range.
Whiskers and Outliers
Whiskers extend from the box toward the lower and upper ends of the data. They show the range of values outside the middle 50%. Their exact endpoints depend on the box plot method used. Outliers are data points that fall far from the main group. They often appear as separate dots beyond the whiskers. These points can help readers spot unusual values in the data set.
How to Create Box Plot Charts in Presentations
A box plot chart can help you show how data is spread across a group. It displays the median, quartiles, minimum, and maximum values. Each part has a role in showing the range and spread of your data. Creating a box plot chart for a presentation takes a few steps. You need to prepare your data, select a chart tool, and adjust its settings. The right labels and colors can also help your audience read the chart.
Prepare and Organize Your Data
Start by collecting the data you want to show in your box plot chart. Place the values in a spreadsheet. Keep each data group in a separate column or row. Add clear headers to identify each group. Check your data before creating the chart. Remove blank cells and fix any typing errors. Make sure all values use the same format. A clean data table makes the chart easier to create and read.
Choose the Right Tool for Your Chart
Pick a tool that supports box plot charts. You can use a spreadsheet or a presentation tool with chart features. Your choice depends on how you plan to create and edit the chart. A spreadsheet can help you organize values and build the chart. You can then copy it into your presentation. Some presentation tools also offer built-in chart options. Check the available chart types before you begin.
Insert a Box Plot Chart
Open your chosen tool and select the data for your chart. Go to the chart menu and look for the box plot option. Select it to create a chart from your data. The chart may appear with default colors and labels. That is fine for now. Focus on getting the correct data into the chart first. You can adjust its look in the next steps.
Add Data and Adjust Chart Settings
Check that the chart uses the correct data range. Each group should appear as a separate box. Review the values to make sure the chart shows the right groups. You can also adjust the chart settings. Set the value range on the vertical axis. Check how the tool displays the median, quartiles, whiskers, and outliers. Make sure each part matches the data you want to present.
Customize Colors, Labels, and Axes
Use clear colors to separate different data groups. Choose shades that are easy to tell apart. Avoid using too many colors in one chart. A simple color scheme helps the audience focus on the data. Add labels to identify each group. Set clear values on the axes. Use a readable font size for all chart text. You can also adjust the box width and line style to make the chart easier to read. Keep the chart simple. Every color, label, and line should help explain the data.
Add a Clear Chart Title and Explanation
Give your box plot chart a short title. It should tell the audience what the data shows. For example, a chart that compares test scores across several classes could use the title "Test Score Distribution by Class." Add a short explanation below or beside the chart. Point out the median, the spread of values, and any outliers that matter to your message. This gives the audience a clear idea of what to look for. Keep the explanation brief. Focus on the main finding rather than describing every part of the chart.
Best Ways to Use Box Plot Charts in Presentations
Box plot charts can help you compare data across different groups. They show the middle values, data ranges, and unusual results in one view. This makes them useful for business reports, school presentations, and customer research.
Here are five ways to use box plot charts in your slides.
Compare Sales Performance Across Regions
A box plot chart can help you compare sales results across different regions. For example, a company may want to review sales from its North, South, East, and West teams. Each box can show the sales range for one region. The median line shows the middle sales value. The whiskers show the spread of the data. Any points outside the whiskers can highlight unusually high or low sales.
This chart helps managers see which regions have steady sales and which have large changes. It also makes regional comparisons easier.
Show Salary Distribution Across Departments
Salary data can vary across departments. A box plot chart can show these differences in a single slide.
You can create one box for each department, such as Sales, Marketing, Finance, and Human Resources. The median line shows the middle salary in each group. The box shows the middle 50% of salaries.
This view helps viewers compare pay ranges across teams. It can also show departments with large salary gaps or unusual values. Add clear department labels and a salary scale to make the chart easy to read.
Compare Student Test Scores
Teachers and school leaders can use box plot charts to compare test scores across classes, grades, or subjects. For example, a chart can show the test scores of students in three different classes. Each box represents one class. The median line shows the middle score. The box and whiskers show how the scores are spread out. This makes it easier to spot differences between classes. A narrow box means the scores are close together. A wide box means there is more variation among students. You can also use separate colors for each class. Add a clear title and label the score scale.
Present Customer Feedback and Ratings
Customer ratings can show how people feel about a product or service. A box plot chart helps present this feedback in a clear way. For example, you can compare customer ratings for several products. Each box shows the rating range for one product. The median line shows the middle rating. The whiskers and outlier points show how the ratings vary. This helps a business see which products receive steady ratings. It can also reveal products with mixed customer opinions. Use a rating scale from 1 to 5 or 1 to 10. Add product names below each box so viewers can compare the results with ease.
Analyze Business Performance Over Time
Box plot charts can also help show changes in business performance over time. You can use them to compare monthly, quarterly, or yearly data.
For example, a company can track its monthly sales figures over one year. Each box represents one month. The median shows the middle sales value. The box and whiskers show the spread of sales results. This view helps teams spot months with stable sales and periods with large changes. It can also show unusual results that need more attention. Add clear time labels along the horizontal axis. Keep the same scale across all periods. This helps viewers compare each period without misreading the data.
Design Tips for Clear Box Plot Slides
A box plot slide should be easy to read. The audience needs to see the data range, median, and differences between groups. Good design helps them understand these details without spending too much time on each chart.
Use Simple and Consistent Colors
Use a small set of colors for your box plots. Keep the same color for each data group across all slides. This helps the audience match each group with its label. Choose colors with enough contrast. Avoid using too many bright shades in one chart. A clean color scheme keeps the focus on the data.
Highlight Important Median Values
The median shows the middle value in a data group. It is one of the key parts of a box plot. Make it easy to spot by using a bold line or a different color. You can also add a small label near the median line. This helps the audience see the middle value without checking the axis each time.
Keep Labels and Axis Text Readable
Use clear labels for each data group. Keep the text large enough to read from a distance. Avoid long group names that take up too much space. Add clear axis titles and value marks. Use a font size that matches the rest of your presentation. Keep enough space between labels to prevent them from overlapping.
Avoid Adding Too Many Data Groups
Too many box plots on one slide can make the chart hard to read. The audience may find it hard to compare each group. Show only the groups that support your main point. Split large data sets across two or more slides. You can also group related data to make the chart easier to follow.
Use Annotations to Explain Key Findings
Short notes can help explain key details in a box plot. Add annotations near unusual values, wide data ranges, or large gaps between medians. Keep each note short and direct. Use arrows or lines to connect the note to the right part of the chart. This helps the audience understand why a data point or group needs attention.
Common Mistakes to Avoid in Box Plot Presentations
A box plot can make data easier to read. However, a few mistakes can make the chart hard to understand. Small errors in data, labels, or layout can also change how people read the results. Keep these points in mind while creating your box plot presentation.
Using Incomplete or Incorrect Data
A box plot depends on accurate data. Missing values or incorrect entries can change the median, quartiles, and whiskers. This can lead to the wrong results.
Check your data before creating the chart. Remove duplicate entries and fix errors. Make sure each group has the correct values. Use a complete dataset to show a fair view of the results.
Misreading Quartiles and Whiskers
Quartiles and whiskers show different parts of a dataset. Mixing them up can lead to a wrong reading of the chart.
The box shows the first and third quartiles. The line inside the box marks the median. Whiskers show the spread of the data beyond the box. Read each part carefully before explaining the results. Add clear labels to help your audience understand what each part means.
Ignoring Outliers
Outliers are values that fall far from the main group of data. They may point to unusual results or large differences in a dataset.
Do not remove or ignore these values without checking them. First, review why they appear in the data. Then, decide how to present them. Use clear markers to show outliers on the chart. Add a short note to explain their possible effect on the results.
Adding Too Much Information to One Slide
A slide filled with too many box plots, labels, and notes can be hard to read. Your audience may miss the main point of the chart.
Keep the layout simple. Show only the groups that matter to your topic. Use short labels and readable text. Split large datasets across multiple slides. This gives each chart enough space and makes the results easier to follow.
Using Box Plots Without Explaining the Results
A box plot shows how data is spread out. But the chart alone may not tell the full story. Your audience needs to know what the results mean.
Add a short explanation near the chart. Point out the median, spread, and any major outliers. Compare groups to show key differences. Use a clear title that tells the audience what the chart shows. This helps people understand the main message without having to study every part of the chart.
Final Notes
Box plot charts help you present data distribution in a clear and simple way. They show the median, quartiles, minimum and maximum values, and outliers in one visual. This makes it easier for your audience to compare groups and spot key differences.
A well-designed box plot slide should have clear labels, simple colors, and readable axes. Use annotations to explain important findings. Keep the number of data groups under control. Most importantly, explain what the results mean instead of leaving your audience to read the chart on their own. With the right data and a clean layout, box plot charts can make your presentations easier to understand and more useful.
Frequently Asked Questions
1. What is a box plot chart used for?
A box plot chart shows how data is spread across a group. It displays the median, quartiles, minimum and maximum values, and outliers. It also helps compare different data groups.
2. What are the five main parts of a box plot?
The five main parts are the minimum value, first quartile (Q1), median, third quartile (Q3), and maximum value. Whiskers and outliers also help show the data range.
3. What does the box represent in a box plot?
The box represents the middle 50% of the data. Its edges mark the first quartile (Q1) and third quartile (Q3).
4. What does the median line show in a box plot?
The median line shows the middle value in a sorted data set. Half of the values fall below it, and half fall above it.
5. What is the interquartile range (IQR) in a box plot?
The interquartile range shows the spread of the middle 50% of the data. It is calculated by subtracting Q1 from Q3. The formula is IQR = Q3 - Q1.
6. How do you show outliers in a box plot chart?
Outliers usually appear as separate dots beyond the whiskers. These points show values that fall far from the main group of data.
7. Can you use box plot charts to compare multiple data groups?
Yes. You can place several box plots side by side to compare different groups. For example, you can compare sales across regions, salaries across departments, or test scores across classes.
8. How can you make a box plot chart easier to read in a presentation?
Use simple colors, clear labels, and readable axis text. Highlight important median values. Avoid adding too many data groups to one slide. Use short annotations to explain key findings.




You may also be interested in ...

Tips To Create A Great Infographic
Infographics Have been around for a while, but not many people know about them or are their preferred presentation choice. If...
08 Jun, 2024

3 Steps To Create The Best Presentation...
Presentations are something wonderful when well done, you can captivate an audience or be super interested in what another pe...
23 Jun, 2024

3 Tips For Your Next Presentation You MU...
PowerPoint presentations are perfect for explaining a topic and communicating your ideas with a visual aid. But most people s...
08 Jun, 2024