How to Use Copilot to Populate a Map in PowerPoint
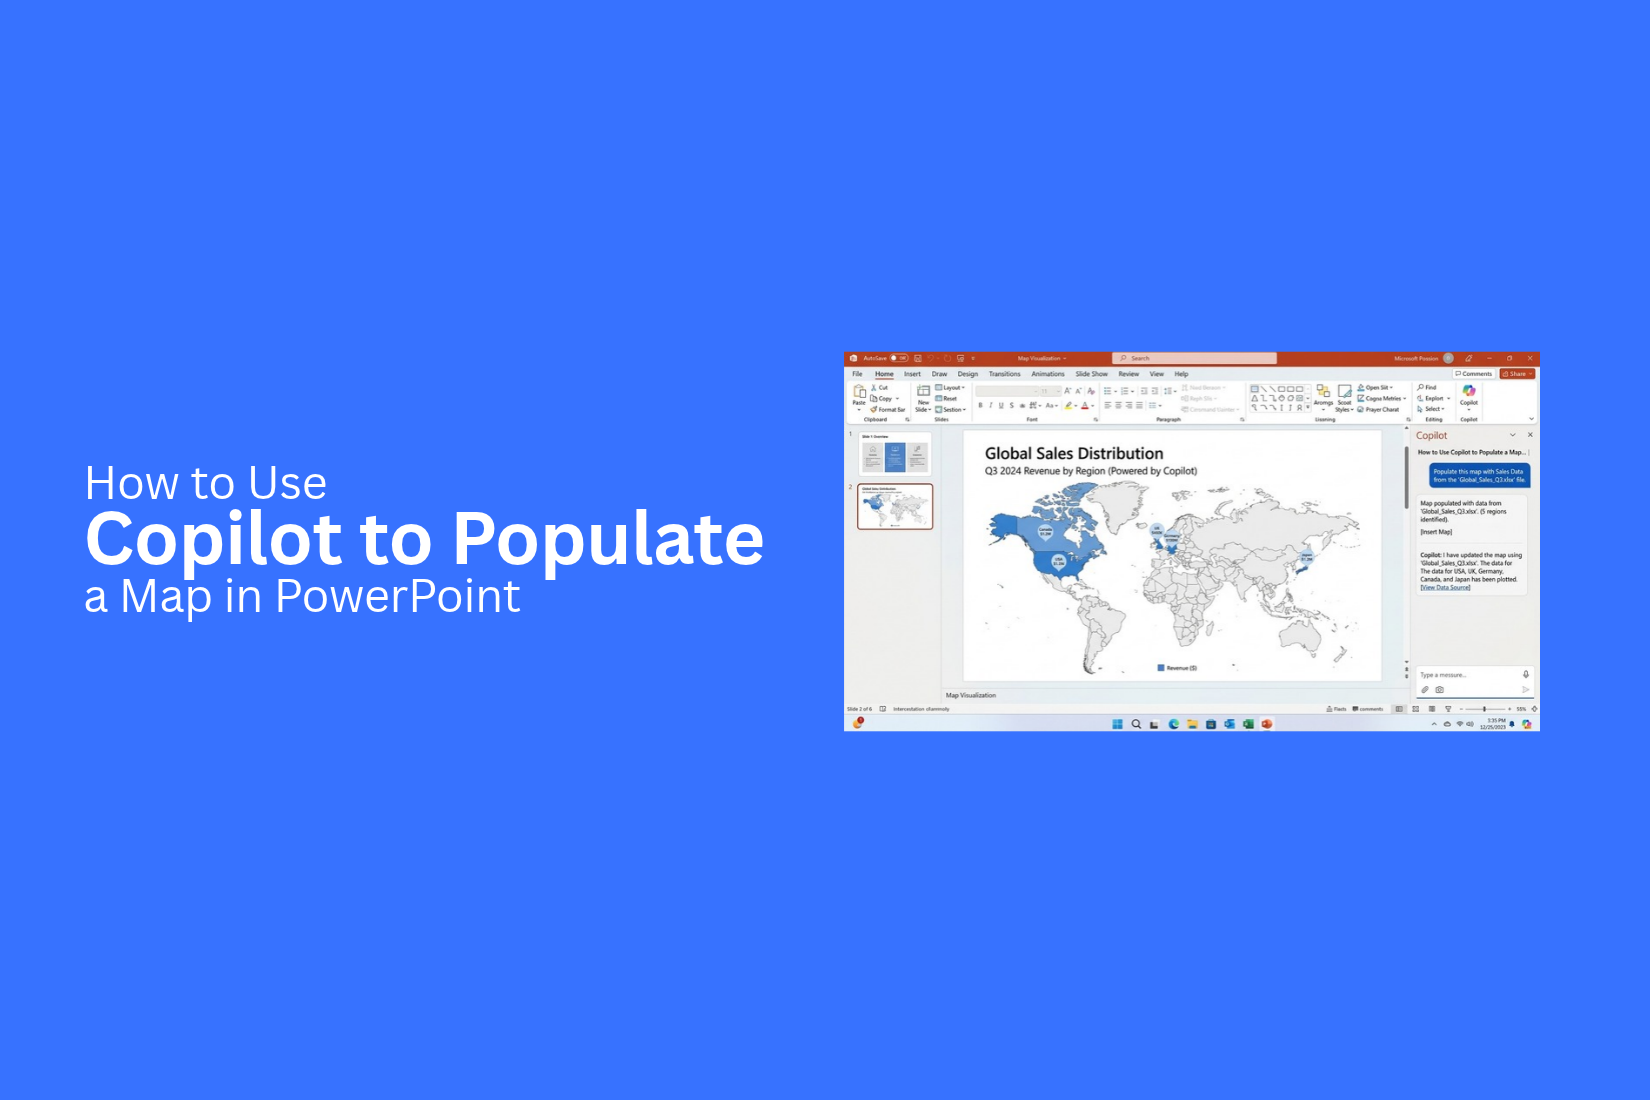
Adding location data to a PowerPoint map can take time. You may need to enter places, check the data, and adjust the map by hand. This can make a simple map take longer to prepare, especially for slides with many locations.
That process can also lead to missing places or data that needs more editing. A map may not show the information in the way you need. Labels may need changes, too. These extra steps can slow down your slide work.
Copilot can help with map data in PowerPoint. You can give it a clear prompt and ask it to add location data to your map. This guide explains how to use Copilot to populate a map in PowerPoint.
What Does It Mean to Populate a Map in PowerPoint?
Populating a map in PowerPoint means adding data to a map so it shows useful location-based information. This can include countries, states, cities, regions, or other places.
A map starts as a visual shape. Data gives it meaning. For example, you can use a map to show sales by state, customers by region, or office locations across different areas. PowerPoint can use map data to create a clearer visual for your presentation. Copilot can also help you work with the map by using your instructions and the data you provide.
The goal is simple. You want the map to show the right places and make the data easy to understand. This can save space on a slide and give your audience a quick view of location-based information.
What You Need Before Using Copilot
Before using Copilot to populate a map in PowerPoint, you need a few things ready. Start with a PowerPoint presentation that includes a map. The map should have clear areas that Copilot can work with. You also need the information you want to show on the map. This may include country names, regions, locations, or other data. Keep the data clear and easy to read.
Make sure Copilot is available in your PowerPoint. You also need an internet connection to use Copilot features. Once these items are ready, you can give Copilot a clear prompt. A clear prompt helps Copilot understand what you want to add to the map.
How to Use Copilot to Populate a Map in PowerPoint
A map can make location-based data easier to read. PowerPoint Copilot can help you add data to a map and shape the content for your presentation. The process starts with adding a map to your slide. Then, you can use Copilot to work with your map data.
Open PowerPoint and Add a Map
Start by opening PowerPoint and creating a presentation or opening an existing file. Go to the slide where you want to add the map.
Add a map to the slide. Set its size and position so there is enough room for other content. Keep the map easy to see. A clear layout will also make later edits easier.
Open Copilot in PowerPoint
With the map on your slide, open Copilot in PowerPoint. You can use the Copilot panel to give instructions about the content on your slide. Keep your request clear. Tell Copilot what you want to do with the map and the data. A short and direct prompt can make the task easier to follow.
Write a Prompt for Your Map Data
Your prompt should tell Copilot what data you want to use and how you want it added to the map. For example, you can provide location names and related values. You can also tell Copilot how you want the data shown. Use clear terms for each location and value. A clear prompt gives Copilot a better starting point. Check that your location names and data are correct before sending the prompt.
Review the Map and Data
After Copilot processes your request, review the map and its data. Check each location and value against your source data. Look for missing locations, incorrect values, or other changes you did not request. This step helps you catch errors before you present the slide.
Edit and Format the Map
Make any needed changes to the map. You can adjust its size, position, text, and other slide elements. Keep the map easy to read. Make sure the data stands out without making the slide feel crowded. A few simple edits can help the map fit the rest of your presentation.
Example Prompts for Populating a PowerPoint Map
Copilot can help you add map details in PowerPoint with simple prompts. A clear prompt tells Copilot what you want to show. It also helps you get a map that fits your presentation.
Add Locations to a Map
Start with a simple location request. Tell Copilot which places you want to add to the map.
Example prompt:
“Add New York, Los Angeles, Chicago, and Miami to this map.”
You can also ask for a group of locations by region.
Example prompt:
“Add the major cities in the northeastern United States to this map.”
Show Regional Data
Maps can help show data across different areas. Tell Copilot what data you want to display and how you want it grouped.
Example prompt:
“Show sales data by region on this map.”
You can also name the regions and add the data you want to show.
Example prompt:
“Show the sales numbers for the Northeast, South, Midwest, and West regions.”
Create a Sales Map
A sales map can show how sales are spread across different locations. Give Copilot the places and sales figures you want to use.
Example prompt:
“Create a sales map for the United States using the sales data on this slide.”
For a more specific result, name the sales values and locations.
Example prompt:
“Show sales by state and highlight states with sales above $1 million.”
Highlight Specific Countries or States
You can ask Copilot to highlight selected areas on a map. This works well for showing target markets, sales areas, or other key locations.
Example prompt:
“Highlight California, Texas, and Florida on this map.”
You can also ask for several countries.
Example prompt:
“Highlight the United States, Canada, Mexico, and Brazil on this map.”
How to Improve Your PowerPoint Map With Copilot
A PowerPoint map works best when the data is clear and easy to follow. Copilot can help you populate a map, but the final slide still needs a clean layout. A few simple checks can make the map easier to understand.
Use Clear and Accurate Data
Start with data that is clear and accurate. Check your location names and values before adding them to the map. Clear data helps Copilot place the right information on the map. It also makes the final slide easier for your audience to read.
Keep Map Labels Easy to Read
Map labels should be easy to see. Use short labels for locations and avoid adding too much text. Give each label enough space. A clean map helps your audience find key locations without taking too much time.
Use Consistent Colors
Use the same color rules across the map. Assign colors based on the type or value of the data. Keep the color choices simple. Too many colors can make the map harder to read.
Add a Clear Map Title and Legend
Give the map a short title that tells readers what the map shows. Add a legend to explain the colors or symbols used on the slide. This gives your audience the context they need to read the map correctly.
Common Issues When Using Copilot With PowerPoint Maps
Copilot can help populate a map in PowerPoint, but the result may not always match your input. You may see missing locations, incorrect data, or map formatting that needs changes. Knowing these common issues can help you fix the map and get a cleaner result.
Copilot Does Not Add the Expected Locations
Copilot may leave out some locations from your request. This can make the map incomplete. Check the locations in your prompt. Make sure each place is named clearly. A clear list can help Copilot understand what you want to add to the map.
Map Data Is Incorrect or Incomplete
The map may show data that does not match your input. Some locations may also be missing details. Review the map after Copilot creates it. Compare the displayed locations with your original data. Make any needed changes before using the map in your presentation.
Map Formatting Needs Manual Changes
The map may need some design changes after Copilot finishes the task. Text, labels, colors, or other map elements may not look the way you want.
PowerPoint lets you edit these elements manually. Adjust the map layout and formatting to match the rest of your presentation.
Copilot Does Not Recognize the Map Data
Copilot may have trouble understanding the data you provide. This can affect how the locations appear on the map. Use clear location names and keep the data easy to read. Check the input before asking Copilot to populate the map. A clean data set gives you a better starting point for the final map.
Tips for Creating Better PowerPoint Maps With Copilot
Copilot can help add data to a map in PowerPoint, but the quality of the result depends on the data and prompt you use. A few simple steps can make the map easier to read and more useful.
Use Clear Data
Keep your data clean and easy to read. Use clear location names and make sure each value matches the right location. This gives Copilot better information to work with.
Give Copilot a Clear Prompt
Tell Copilot what you want to add to the map. Include the locations, values, and the type of map you need. A clear prompt gives Copilot better direction.
Keep the Map Simple
Do not add too much data to one map. Focus on the locations that support your main point. A simple map is easier for your audience to read.
Check the Map After Copilot Fills It
Review every location and value after Copilot creates the map. Check the labels, data, and layout. Make any needed changes before using the slide in your presentation.
Match the Map to Your Slide
Make sure the map fits the rest of your presentation. Use readable text and enough space around the map. The map should support your message instead of taking attention away from it.
Final Notes
Using Copilot to populate a map in PowerPoint can save time when working with location-based data. A clear prompt and clean data give you a better starting point.
Always review the map after Copilot adds the data. Check locations, values, labels, colors, and formatting. Fix any errors or missing details before presenting the slide.
Keep your map simple and easy to read. Use clear labels, consistent colors, and a short title. A well-organized map can help your audience understand location-based data with less effort.
FAQs
Can Copilot populate a map in PowerPoint?
Yes. Copilot can help add location data to a PowerPoint map based on the prompt and data you provide.
What data can I add to a PowerPoint map with Copilot?
You can add countries, states, cities, regions, and related values such as sales data.
How should I write a Copilot prompt for a PowerPoint map?
Use clear location names and explain what you want to show. You can also include values and how you want the data displayed.
Why does Copilot leave out some map locations?
Copilot may not add every location from your request. Check your prompt and make sure each location is named clearly.
Can I edit a map after Copilot populates it?
Yes. You can manually change the map size, position, labels, colors, text, and other slide elements.
How can I make a PowerPoint map easier to read?
Use clear labels, simple colors, a short title, and a legend. Avoid adding too much data to one map.
Should I check the map after Copilot adds the data?
Yes. Review every location and value. Compare the map with your original data and fix any missing or incorrect details.
What should I do if Copilot does not recognize my map data?
Check that your location names and data are clear and easy to read. Then provide Copilot with a more direct prompt.


You may also be interested in ...

How To Create An Eye-Catching Portfolio
If you’re looking to create an eye-catching portfolio, this post will come in handy. In this article, you can find the easies...
23 Jun, 2024

How To Easily Create An Infographic
Infographics are the perfect way to make a presentation that will impact an audience, but their design and composition might...
08 Jun, 2024

PowerPoint Template Tips & Tricks You Ne...
PowerPoint seems to be an unknown world for many people, especially those who have been assigned to create a presentation out...
08 Jun, 2024