How to Present ROI to Clients in Presentations
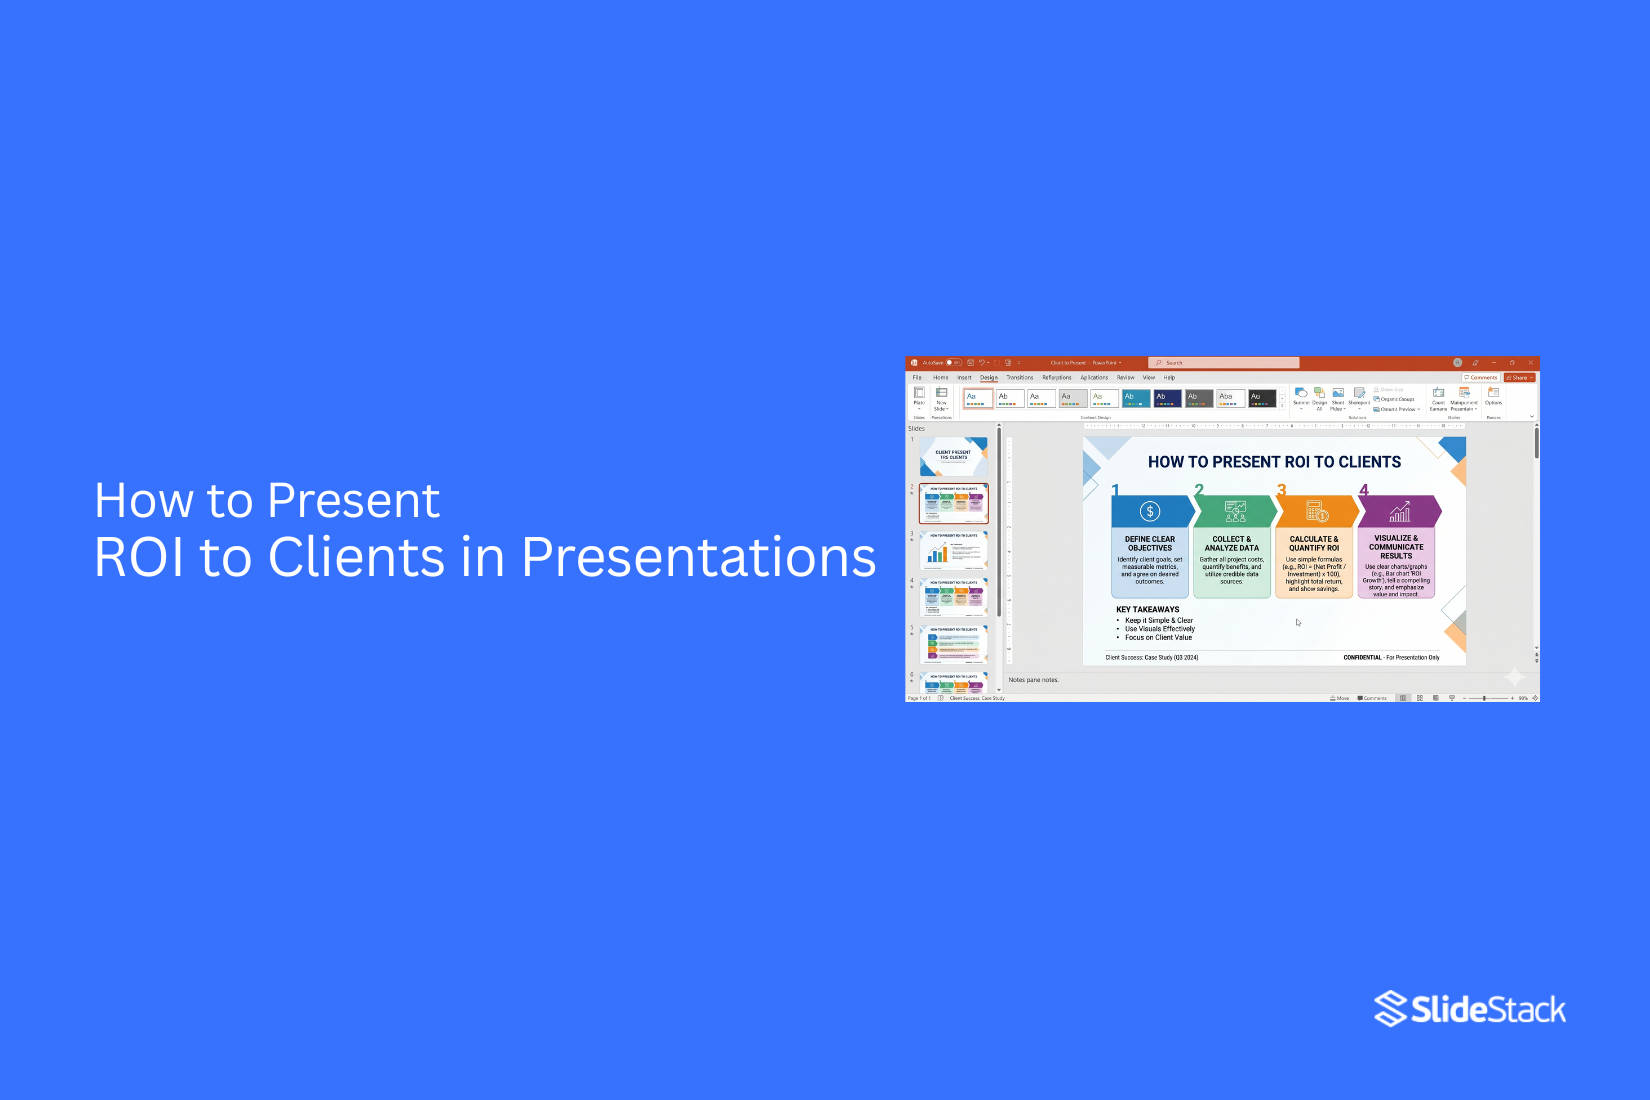
Return on Investment sits at the center of client presentations because it guides decisions on spending and value. Yet many presentations fail to make this connection clear. Numbers appear on slides, but the meaning behind them feels weak. This leads to hesitation and questions about value. The issue is not the calculation itself but how it is framed for decision-making. It creates uncertainty during reviews and slows agreement on next steps. This article explains how to present ROI to clients in a way that supports decisions instead of overwhelming them with figures. The focus is to turn ROI into a clear story of value, built on transparency and structure.
Why ROI Shapes Client Decisions
ROI is often treated as a final number in business talks. That view is narrow. ROI is not only a result. It is a way clients form judgment. It shapes how they read value before any choice is made. The number sits at the end, but its influence starts much earlier. Clients use ROI as a source of reassurance. It gives structure to complex choices. Many decisions carry uncertainty. ROI reduces that feeling by turning ideas into measurable outcomes. It creates a sense of order. That order helps clients feel grounded when options compete for attention. ROI also works as a filter. Clients do not treat all proposals the same. They sort ideas based on expected return. A strong ROI draws focus. A weak ROI loses attention. This filtering happens quickly. It guides what stays in the discussion and what gets set aside. The number becomes a mental shortcut for value.
The presenter and the client must stay aligned through this lens. ROI is not just presented. It is interpreted. Clients read it based on trust, clarity, and logic in the argument behind it. If the reasoning feels weak, the ROI loses weight. If the structure is clear, the ROI carries more influence. The alignment between story and number matters more than the number alone. In higher-stakes decisions, ROI becomes part of long-term judgment. Clients look beyond immediate gain. They connect ROI with risk, stability, and future direction. The number turns into a reference point for broader thinking. It supports direction rather than finality. In that sense, ROI is not only about return. It is an argument that guides how decisions take shape.
Clarifying the Type of ROI You’re Presenting
ROI often looks simple on the surface. It appears as a single number that shows return against cost. That simplicity hides different meanings. People can read the same ROI figure in different ways. That leads to confusion in decisions and weak alignment in discussions. A clear definition removes that confusion. It sets the frame for what the number actually represents. Without that frame, ROI becomes a loose signal instead of a clear decision input. Different teams may then speak past each other while using the same term.
Financial ROI vs Operational ROI
Financial ROI focuses on money outcomes. It compares revenue gains or cost savings against what was spent. This version is used in budget discussions and investment cases. It stays close to accounting logic and measurable financial change. Operational ROI focuses on performance inside the system. It looks at efficiency, speed, capacity, or output quality. The value may not show up directly as revenue right away. It still changes how work gets done and how resources are used. Mixing these two creates distortion. A financial return may look weak while operational gains are strong. The reverse can also happen. Clear separation keeps the evaluation stable.
Short-Term ROI vs Long-Term ROI
Short-term ROI captures results within a limited window. It highlights immediate returns after an action or investment. This view helps track early performance signals. Long-term ROI tracks outcomes over extended periods. It includes delayed effects, compounding gains, and sustained impact. Some investments only show value after systems mature or adoption spreads. A narrow time view can hide the full effect. Short-term gains may look strong while long-term value remains unseen. Long-term focus may also overlook early pressure on resources. Both time frames need clear labeling to avoid misreading results.
Attribution and Multi-Factor Influence
ROI rarely comes from a single cause. Many inputs shape the final outcome. Marketing, pricing, operations, and external conditions often interact at the same time. Attribution defines how much credit each factor receives. A simple model may assign full credit to one activity. A more complex view distributes influence across several drivers. Without clear attribution rules, ROI becomes subjective. One team may claim complete success. Another may point to shared contribution. Structured attribution reduces this overlap and keeps evaluation consistent.
Modeled ROI vs Measured ROI
Modeled ROI comes from projections. It uses assumptions, benchmarks, and expected outcomes. It helps before action is taken. It guides planning and decision direction. Measured ROI comes from actual results. It relies on real data after execution. It shows what actually happened, not what was expected. Gaps between these two are common. Models may assume ideal conditions that do not appear in practice. Measured results may also reflect external shifts that were not part of planning. Comparing both helps refine future assumptions and improve accuracy over time.
Tracing the Path From Investment to Outcome
Problem: weak causal explanation
Many presentations fail at a basic point. They list results without showing how those results were created. This weakens trust. The audience cannot see the link between spending and value. Numbers alone do not explain performance. The missing link is the process that connects action to result. Clear reasoning removes this gap. Each outcome must connect back to a clear set of inputs. Without this, ROI claims feel unsupported.
Investment breakdown
The first step is clarity on investment. Investment is not only money. It includes time, tools, systems, and labor. Each part must be stated in plain terms. Nothing should stay hidden or grouped in a vague label. A clear breakdown shows where resources go. It separates costs into visible parts. This creates a stable base for the rest of the explanation. Once inputs are clear, confusion drops. The audience can see what is being used and in what form.
Mechanism of return
The next step is the mechanism. This is the link between input and outcome. It explains how actions create change. It is the working path between cost and result. Each input must connect to a specific action. Each action must connect to a change in performance. This may involve process speed, customer response, or output quality. The focus stays on cause and effect. No result appears on its own. Every outcome has a direct source in the system. When this chain is clear, the logic becomes easy to follow. The return is no longer abstract. It becomes traceable.
Linking actions to metrics
The final step is measurement. Actions must connect to numbers that show impact. These may include revenue, cost reduction, conversion rate, or time saved. Each metric must match a specific action from the system. This link closes the loop. Investment becomes visible in the metric change. The audience can track the full path from input to outcome. Without this step, the analysis stays incomplete. With it, performance becomes measurable and defensible. The strength of ROI communication depends on this chain staying intact from start to finish.
Tracing the Path From Investment to Outcome
ROI often loses strength when the link between cost and result is not clear. The number may look correct. The reasoning behind it feels thin. That gap reduces trust in the message. A stronger approach shows the full path in clear steps. The explanation starts with an investment breakdown. This is the point where all inputs are named with care. Money is one part. Time is another. Tools, systems, and human effort also belong here. Each item needs to be visible so the total cost is not misunderstood. Without this step, ROI can look inflated or incomplete. A clear base sets control for everything that follows.
The path then moves to the mechanism of return. This part shows how input turns into change. It should stay concrete. No vague claims. A marketing effort may improve conversion rates. A process change may reduce delays. A training program may reduce errors and improve speed. Each case needs a clear line from action to effect. Without that line, the result feels assumed rather than proven.
After that comes linking actions to metrics. This is where behavior connects to measurement. A change in process should link to the time saved. A change in messaging should link to lead quality. A change in operations should link to cost reduction. The logic must stay direct so the audience can follow without effort.
Investment → Mechanism → Metric effect → Outcome
This chain keeps the structure simple. It shows how value moves from one stage to the next. Each step depends on the one before it. The final step is proportionality. This is where scale matters. A strong result still needs context. A small return on a high cost may still hold value, but the reason must be clear. A large return on a small cost must also be explained in a grounded way. The goal is a balance between input and output.
Designing ROI Evidence on Slides
Core premise: ROI is not easy to read at first glance. Viewers do not process it without support. Slide design must turn numbers into a clear visual meaning. Each element should reduce effort for the viewer. Confusion lowers trust in the message.
Principle of hierarchy: The main ROI figure sits at the top of attention. Size and placement guide the eye first. Supporting details stay secondary. Layout guides reading order without extra explanation. One clear focal point drives understanding.
Principle of context: ROI without context loses meaning. The time range sits near the main figure. Baseline values stay close to comparisons. Calculation notes remain visible but not dominant. Each part gives meaning to the main number.
Principle of chart selection: Different charts serve different roles. Bar charts show clear comparisons. Line charts show movement over time. Waterfall charts show step changes in value. Each chart matches the type of question being answered. Wrong chart choice slows understanding.
Principle of color discipline: Color carries meaning across slides. One color can represent positive movement. Another color can show cost or reduction. Repetition of the same meaning builds recognition. Random color use creates confusion. Consistency keeps interpretation steady.
Principle of visual hierarchy for supporting metrics: Supporting numbers stay aligned in stable positions. Viewers scan in patterns, not randomness. Group related metrics together. Separate unrelated data clearly. Stable placement improves reading speed and accuracy.
How to Present ROI to Clients in Presentations
Structuring an ROI Presentation
An ROI presentation needs a clear structure. Each part should guide the client from context to outcome. The goal is to make the financial impact easy to follow without confusion.
Executive Summary Slide
This slide gives a short view of the full story. It shows the main goal, action taken, and result in a simple form. Clients should understand the outcome within a few seconds. Keep it direct and focused on value.
Business Challenge Overview
This section explains the problem the client faced before action was taken. It sets the starting point. Keep facts clear and specific. Avoid long background detail. Focus on what made the situation difficult or costly.
Strategy and Actions Implemented
This part explains what was done to address the challenge. List the main steps taken and why they were chosen. Keep each action simple and clear. Show how each step connects to solving the problem.
Results and Performance Outcomes
This section shows what changed after the actions. Use clear performance changes such as growth, savings, or efficiency gains. Keep numbers easy to read. Focus on direct outcomes tied to the strategy.
ROI Analysis and Financial Impact
This part connects results to money. Show cost versus return in simple terms. Break down gains so the client can see value clearly. Avoid complex financial language. Keep the focus on what was gained compared to what was spent.
Recommendations and Next Steps
This section guides future action. Explain what should happen next based on the results. Keep suggestions practical and realistic. Focus on improving or building on the outcome already achieved.
Explaining ROI Variability, Constraints, and Causality
Core principle
ROI does not stay fixed. It changes across time and setting. A single ROI number does not describe full performance. It reflects one point in a wider system. Clear reporting needs context. Without context, the number loses meaning.
Variability lens
ROI shifts across conditions. Market demand affects results. Customer behavior also changes outcomes. Internal execution plays a role, too. Timing also matters. Early periods can show weak returns. Later periods can show stronger returns. The same activity can show different results across phases. Small changes in input can create different output patterns. This makes ROI a moving measure, not a stable one.
Constraint lens
Limits shape results. Budget size affects reach. Team size affects speed. Tools affect execution quality. Rules and approvals slow down action in some cases. Resource gaps also change output strength. These limits do not just reduce results. They reshape how results form. ROI reflects those boundaries.
Causality lens
ROI must connect to cause. A result without a cause is weak for decision - use. Clear links are needed between action and outcome. Sales growth should connect to a specific change. Cost savings should connect to a specific step. Mixed signals often appear. One action may raise one metric and lower another. Careful review is needed to separate the real cause from the surface movement.
Mixed results lens
ROI does not always move in one direction. Some parts of a system improve while others drop. A campaign may raise traffic but lower conversion quality. A process change may reduce cost but slow delivery. These mixed results carry meaning. They show where pressure exists in the system. They also show where adjustment is needed.
Risk lens
Future ROI is not stable. It carries variation from outside forces. Market shifts and internal limits both affect it. Clear reporting should show ranges, not single points. Stability signals matter more than peak values. Strong interpretation depends on recognizing movement, limits, and cause together.
Handling Objections and Questions About ROI
ROI presentations bring questions from clients. These questions focus on numbers, logic, and proof. The goal of the discussion is clarity. The presenter stays steady and uses simple reasoning. Authority comes from calm structure, not strong language or pressure.
Clients test attribution models. A common challenge points to outside forces shaping results. The response stays focused on measurement design. The presenter states what was tracked and how the results were linked to the activity. External factors such as market movement or timing effects are acknowledged in plain terms. The aim stays on showing how the result was built, not forcing agreement.
Cost structure often becomes another point of discussion. Attention shifts to what was included in the calculation. Some clients question missing items or category choices. A clear response breaks costs into simple groups such as media, production, and operational input. Each group follows the same rules set across the analysis. Consistency in structure keeps the discussion grounded.
Timeframe concerns appear during review. Focus turns to the length of the evaluation period. Some results show short-term impact. Other results reflect longer value creation. The presenter explains the reason for the chosen period using business cycle patterns and performance timing. Different time horizons stay part of the same framework. This keeps the comparison balanced.
Expectation gaps create another type of objection. Clients compare outcomes to what was expected at the start. The response returns to the original goal of the work. The presenter links results back to that goal using direct language. Differences between expected and actual outcomes are explained through scope, timing, and performance drivers. The goal is alignment between intent and outcome.
Delivery during these discussions shapes perception. Short pauses before answering help maintain control of thought. Answers stay direct and supported by evidence, such as figures or defined steps. The tone remains steady throughout the exchange. Clear delivery signals that the analysis holds under review and does not rely on persuasion.
How to Present ROI to Clients in Presentations
Communicating ROI to Different Stakeholders
ROI messages change based on who is in the room. Senior leaders focus on business impact. Finance teams focus on cost logic. Marketing teams focus on performance details. A clear presenter adjusts the depth of explanation without changing the core message. The numbers stay the same. The framing shifts. Leaders hear the outcome in business terms. Finance teams see how the calculation was built. Technical teams see the performance path in simple steps. Clarity across groups prevents confusion later. One message with different levels of detail keeps alignment across the organization. This reduces repeated questions and keeps the discussion stable.
Handling Questions About ROI
ROI questions come during presentations. Clients want clarity on how results were formed. These questions focus on structure, data, and logic. A steady tone helps keep control of the discussion. The goal is not to defend the number. The goal is to show how the number was created. Each answer follows the same pattern. Clear source, clear method, clear result.
Explaining Data Sources
Clients often ask where the data comes from. This question focuses on trust and accuracy. A clear answer starts with naming the systems or records used. Reporting tools, sales records, and campaign data all sit inside the explanation. Each source connects directly to the calculation. No extra detail is needed. Short sentences build confidence. The focus stays on traceability. The client should be able to follow the path from raw data to the final result without confusion.
Defending Methodology
Questions about the method focus on how the ROI was calculated. Clients may want to know why a certain formula or approach was used. The response stays simple. The method is explained in steps. Inputs are defined first. Then the calculation logic is shown. Then the output is presented. Consistency matters more than complexity. The same method applied across all results builds trust. Changing logic across sections weakens the argument.
Addressing Attribution Concerns
Clients often question what caused the result. They may point to outside influences such as seasonality, market shifts, or prior brand activity. A strong response explains how attribution was assigned. The presenter states what was measured and how it links to activity. External influence is acknowledged without exaggeration. The goal is balance. Results are not claimed as an absolute cause and effect. Results are presented as measured outcomes within a defined system.
Discussing Future Projections
Some discussions move toward expected future results. Clients want to understand what may happen next based on current ROI patterns. The response stays grounded in past performance and known assumptions. Projections are framed as scenarios, not guarantees. Each scenario follows a clear logic path based on inputs and trends already observed. This approach keeps expectations realistic. It also shows that planning is based on structure, not guesswork.
Best Practices for ROI Presentations
Start with the goal behind the ROI story. Clients want to see how value connects to their spending. The focus stays on clarity, not scale or volume of data. Break ROI into clear parts. Show cost, return, and time frame in simple terms. Each part should stand on its own so the audience does not get lost. Use numbers that match the client's goal. A mismatch between metrics and goals weakens trust. Keep every figure tied to a clear outcome.
Keep the flow steady across slides. Each slide should lead into the next without confusion. The order of ideas matters more than visual design. Avoid heavy detail that slows reading. Too much data hides the main point. Stick to the figures that support the message. Close the section with a direct link back to the client outcome. The value should feel connected to their decision and next steps.
Common ROI Presentation Mistakes to Avoid
Many ROI presentations lose clarity because the message is not specific. Vague claims like “strong returns” leave room for doubt. Clients need clear numbers and a clear meaning behind those numbers. Another issue is missing context. ROI without a baseline feels empty. A return means little without showing what it is compared against. Cost, time, or effort needs to be visible so the result makes sense. Some presentations focus too much on the final number. This hides the process that created it. Clients often want to know how the result was formed. Without that, trust drops.
There is also the problem of ignoring client goals. ROI tied only to general outcomes does not connect with what the client actually wants. A result must match the reason the project started. Overly complex metrics create distance. Too many layers of calculation make the message hard to follow. Simple breakdowns work better. One clear path from input to output keeps attention steady. Strong ROI communication stays direct. It shows value in a way that is easy to follow and hard to misunderstand.
Final Notes
Presenting ROI focuses on decision clarity, not number defense. A clear ROI story links cost, action, and result in a direct line. It gives clients a simple structure to judge value and direction. Assumptions are stated in plain form. This keeps meaning stable and easy to follow. ROI then becomes a shared reference for judgment rather than a point of debate.
Clear ROI reporting also builds accountability inside teams. Results can be traced back to actions without gaps or confusion. Each outcome carries a visible link to the work behind it. This makes review more direct and grounded in facts. Trust grows as reporting stays consistent and open across discussions. ROI works as a decision tool that supports action. It allows a clear path for moving ahead, changing direction, or stopping work. Strong structure leads to clear choices. Weak structure leads to hesitation.
FAQs
How detailed should ROI explanations be?
Clarity matters more than depth. The goal is understanding, not reconstruction. Core drivers and assumptions sit in the main slide. Detailed calculations belong in the supporting material. This keeps focus on interpretation instead of math steps.
Should ROI always be shown as a percentage?
Not always. Percentages help with comparison across projects. Absolute values work better for budget impact and cost savings. Efficiency measures fit well for operational changes.
How should ROI be compared across different initiatives or vendors?
Only comparable setups should be placed side by side. The same baseline, time frame, and assumptions must be used. Without that alignment, the comparison loses meaning.
How should underperformance in ROI be presented?
Performance gaps should be linked to constraints and execution factors. Focus on what shaped the result rather than framing it as a failure. Then outline what changes in the next cycle.
What is the difference between modeled ROI and measured ROI?
Modeled ROI is based on assumptions before execution. Measured ROI comes from actual results after delivery. The two should never be mixed.
How should qualitative value be handled in ROI discussions?
Not all values fit into numbers. Brand impact, customer experience, and speed gains still matter. These should be tied to decision impact, even if not fully quantified.
How is long-term ROI communicated effectively?
Long-term returns should be linked to strategy, not just time. Break down how value builds across stages. Early signals can be shown alongside later financial outcomes.
How should risk be reflected in ROI comparisons?
Risk changes how returns are interpreted. Stable returns may be preferred over higher but volatile outcomes. Variability and uncertainty should sit alongside the ROI figure.
How should differences in ROI across segments be interpreted?
Variation across segments often points to different operating conditions. It can highlight where performance is stronger or weaker. These patterns help guide where to adjust focus.
When are benchmarks useful in ROI reporting?
Benchmarks work only when the source data is reliable and aligned. Misaligned benchmarks create false confidence. Internal consistency is often more useful than external comparison.
How should ROI assumptions be handled in presentations?
Assumptions need to be visible and explained. Scenario testing helps show how outcomes change under different conditions. This builds trust in the structure of the analysis.


You may also be interested in ...

How To Create An Eye-Catching Portfolio
If you’re looking to create an eye-catching portfolio, this post will come in handy. In this article, you can find the easies...
23 Jun, 2024

How To Easily Create An Infographic
Infographics are the perfect way to make a presentation that will impact an audience, but their design and composition might...
08 Jun, 2024

PowerPoint Template Tips & Tricks You Ne...
PowerPoint seems to be an unknown world for many people, especially those who have been assigned to create a presentation out...
08 Jun, 2024