KPI Finances Infographics Presentation Template Premium
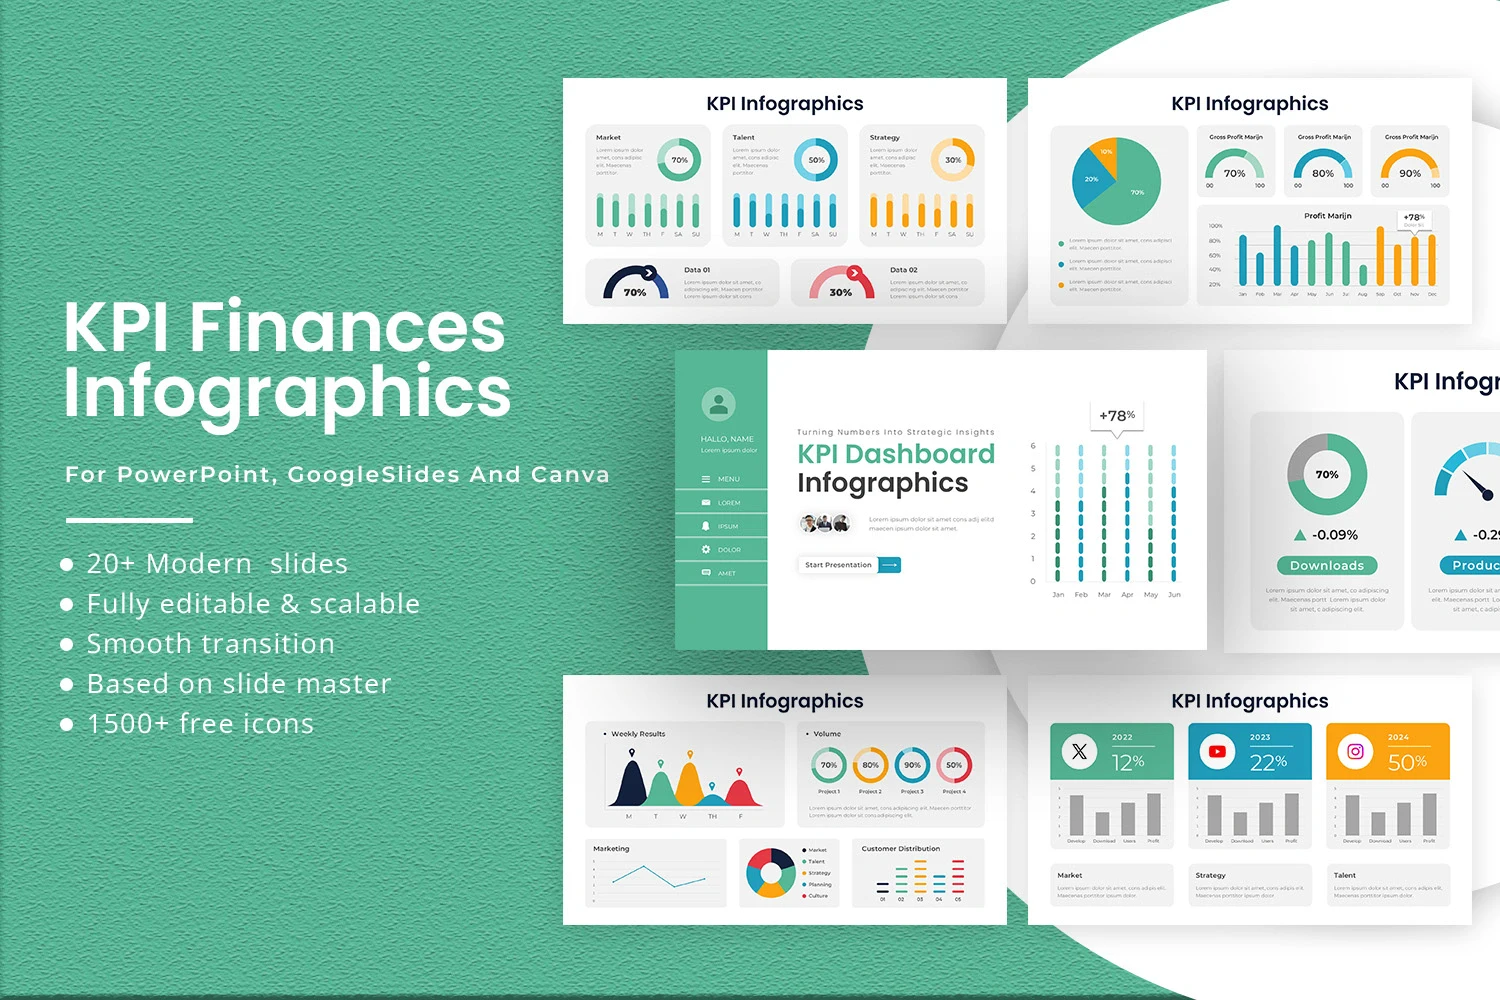
Presenting financial KPIs clearly is not easy, especially when stakeholders need to grasp complex trends quickly and reports are filled with numbers that lack context.
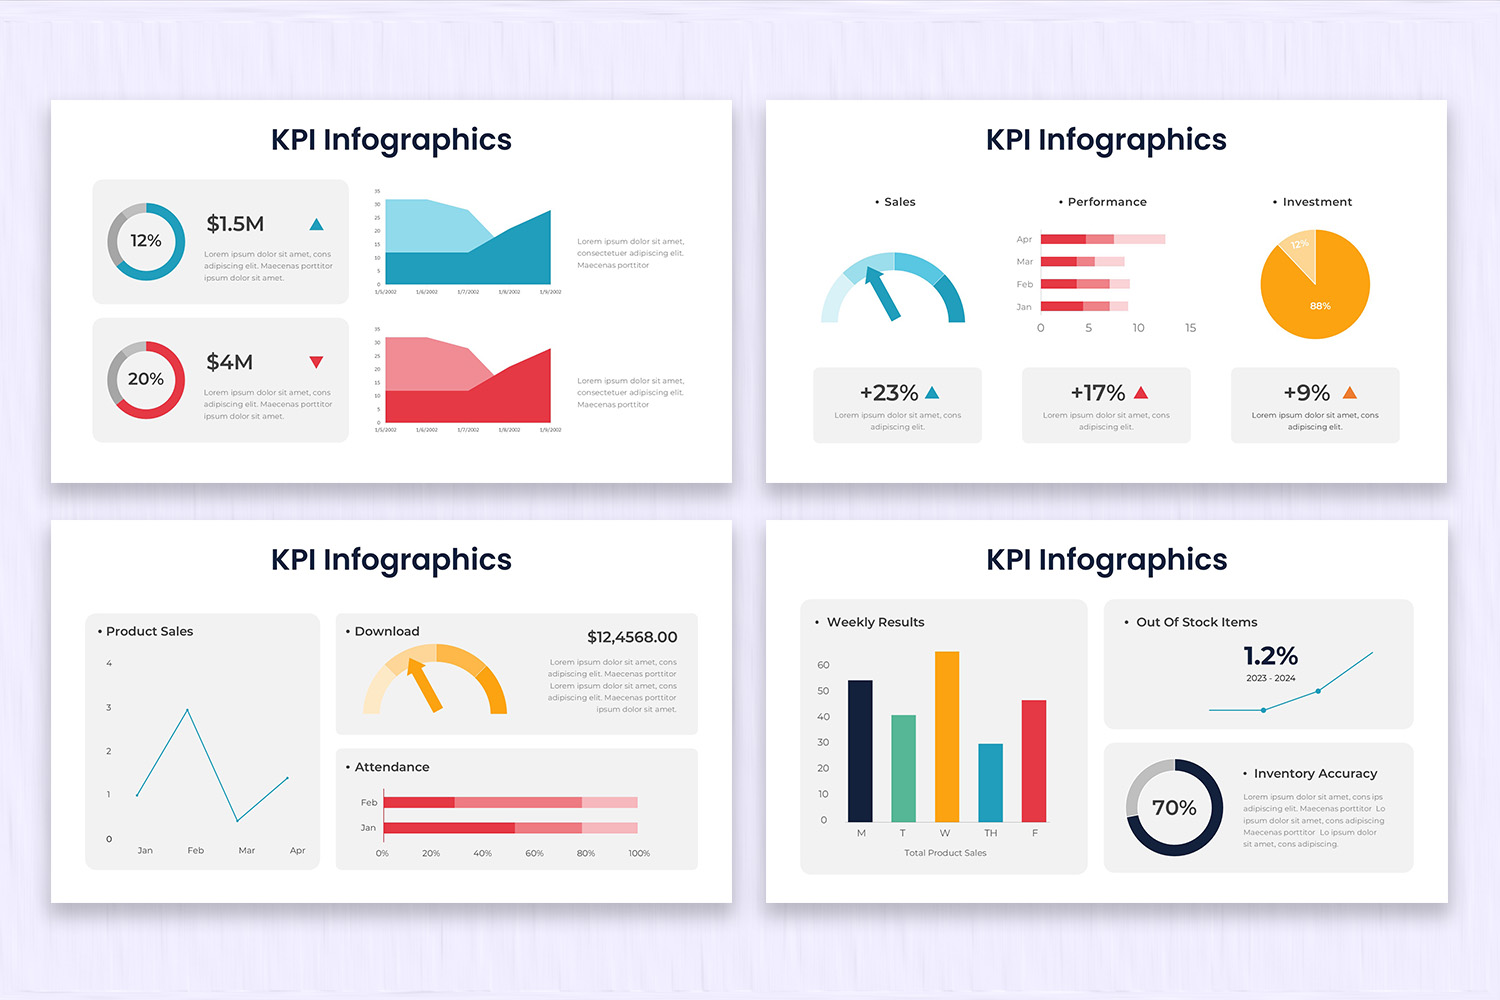
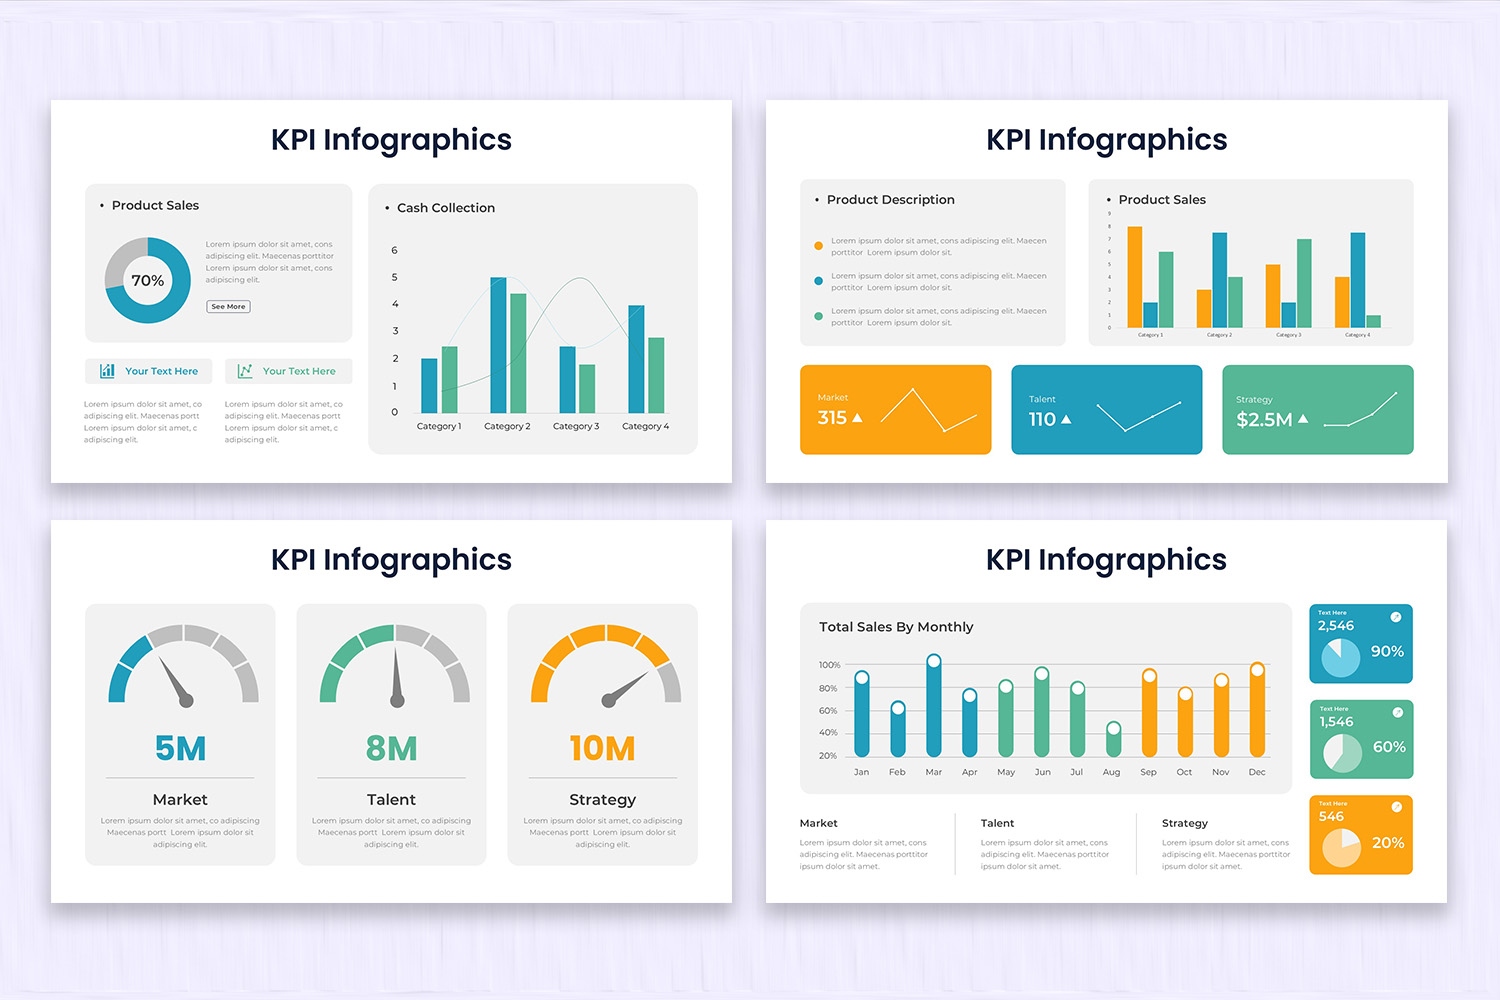
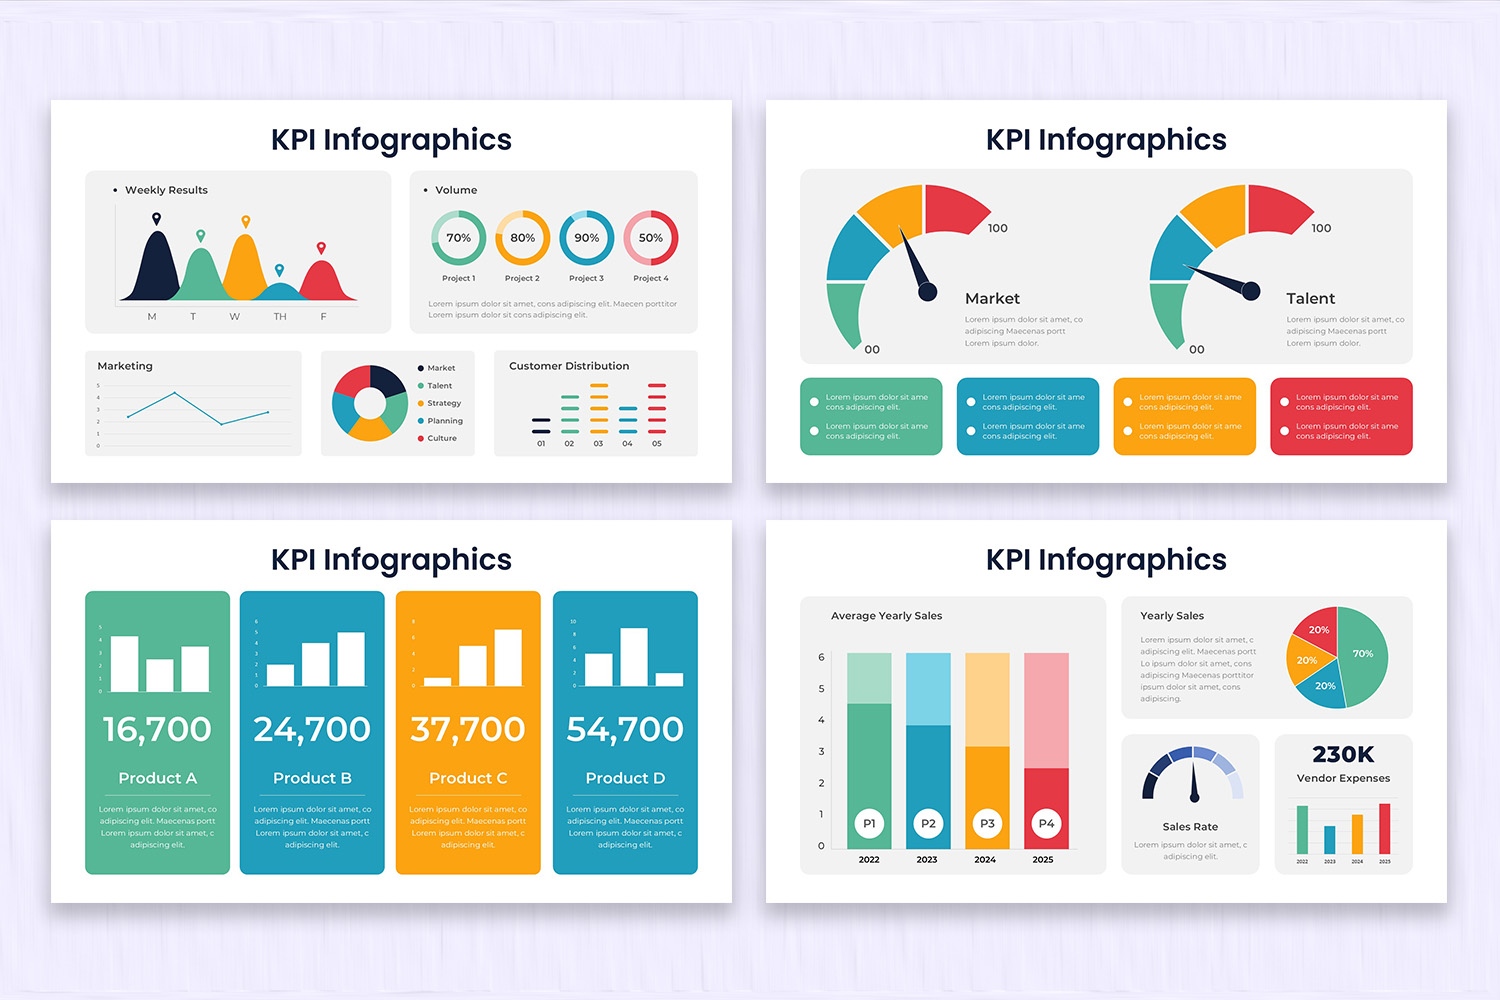
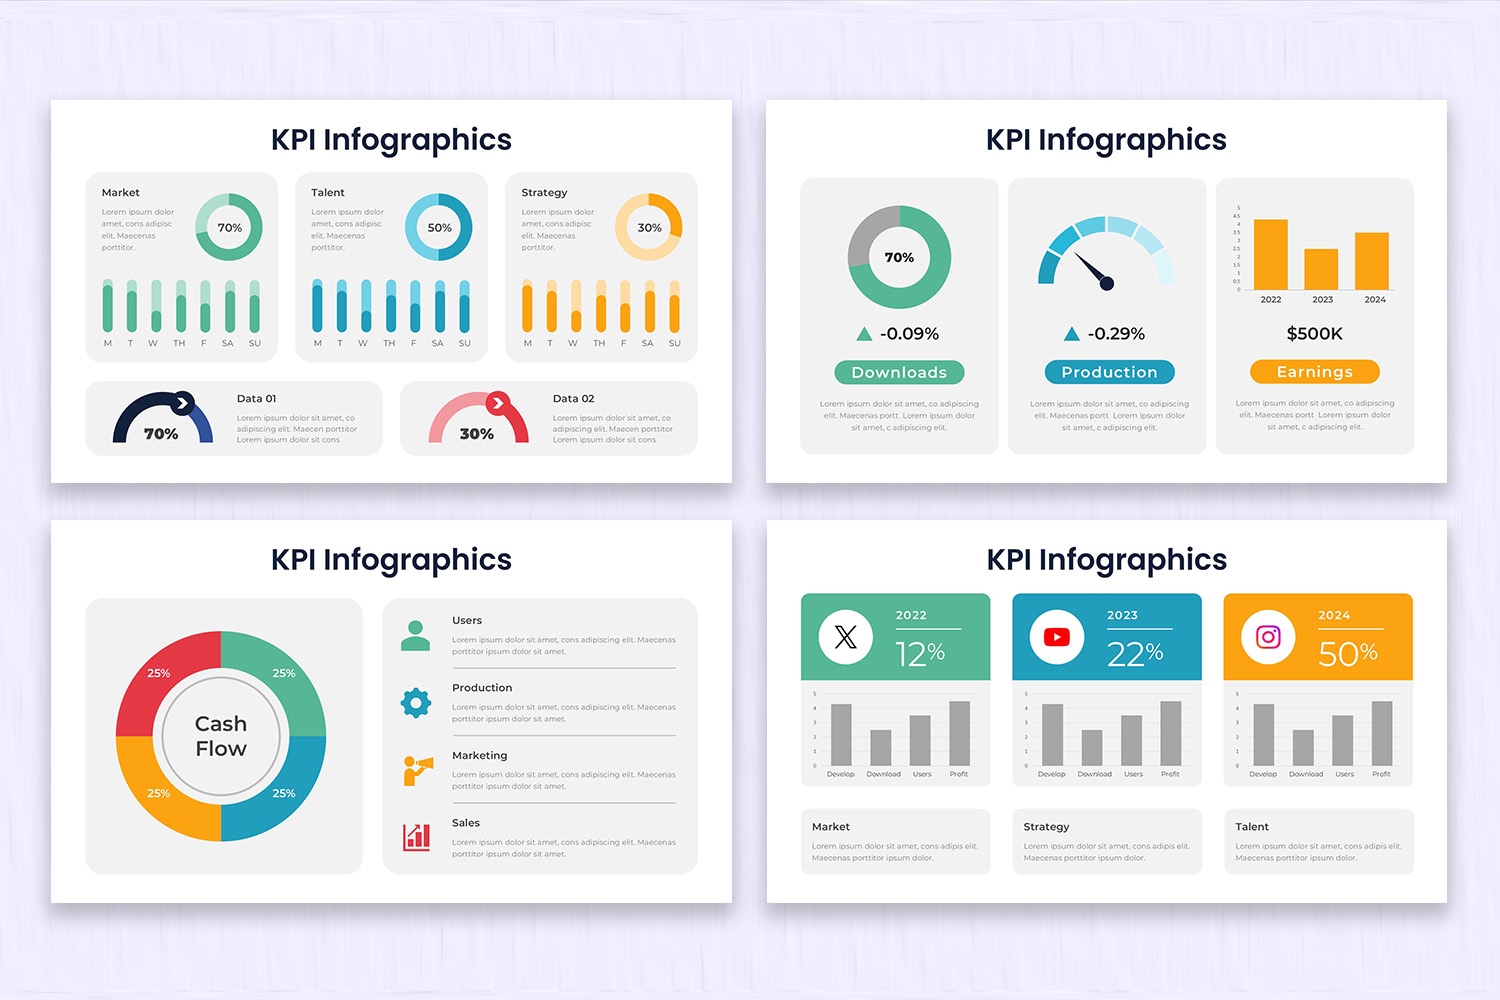
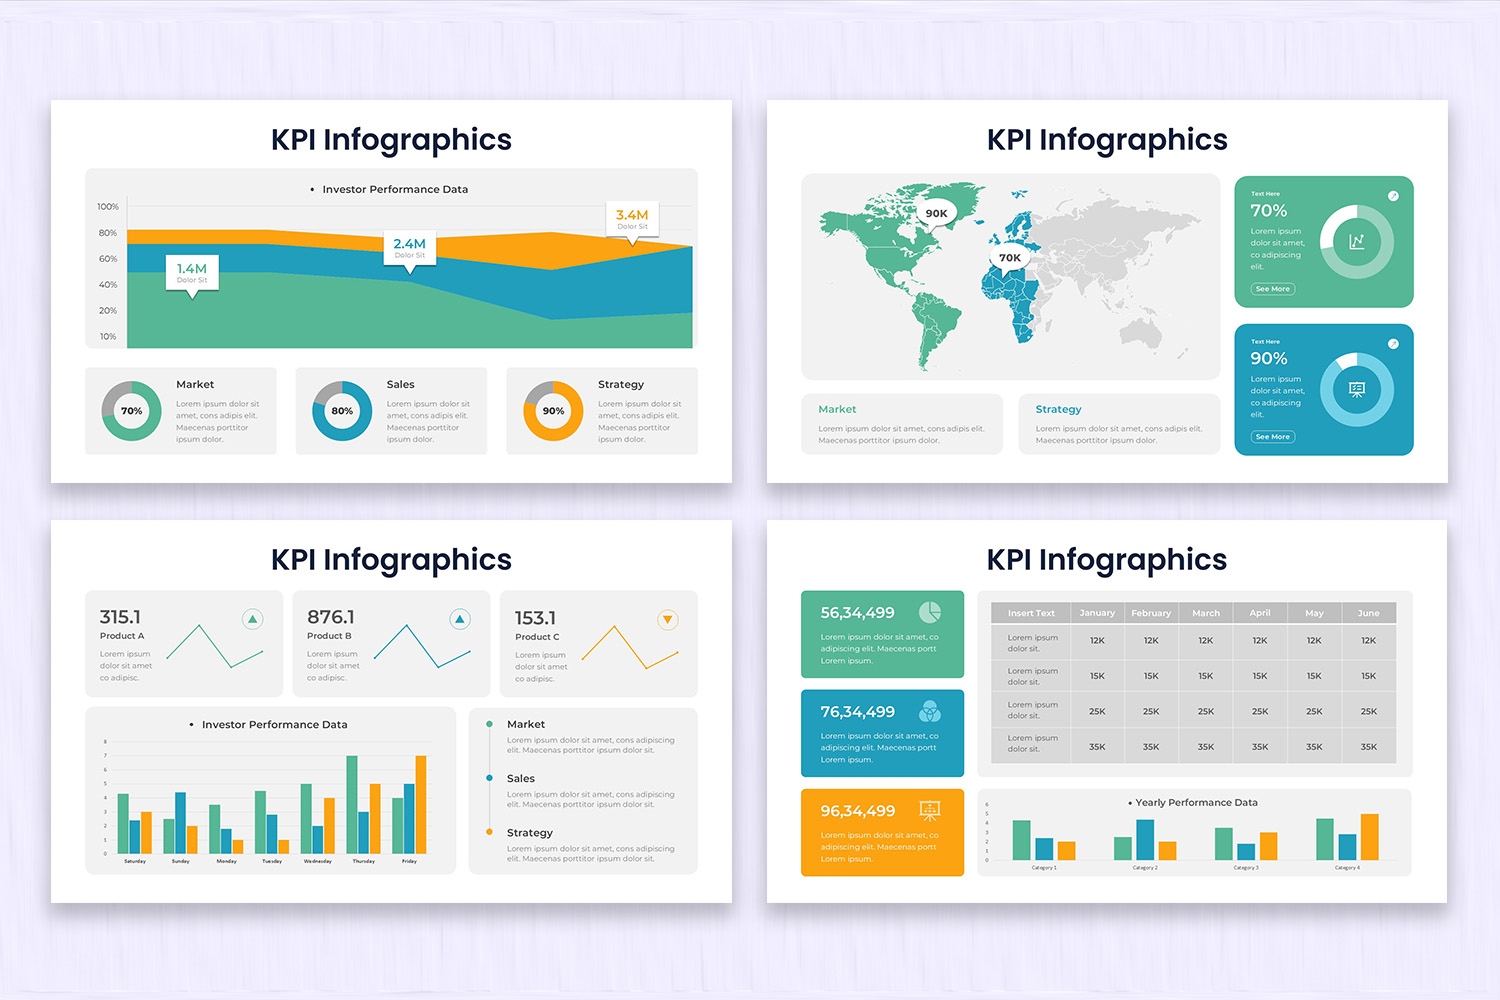
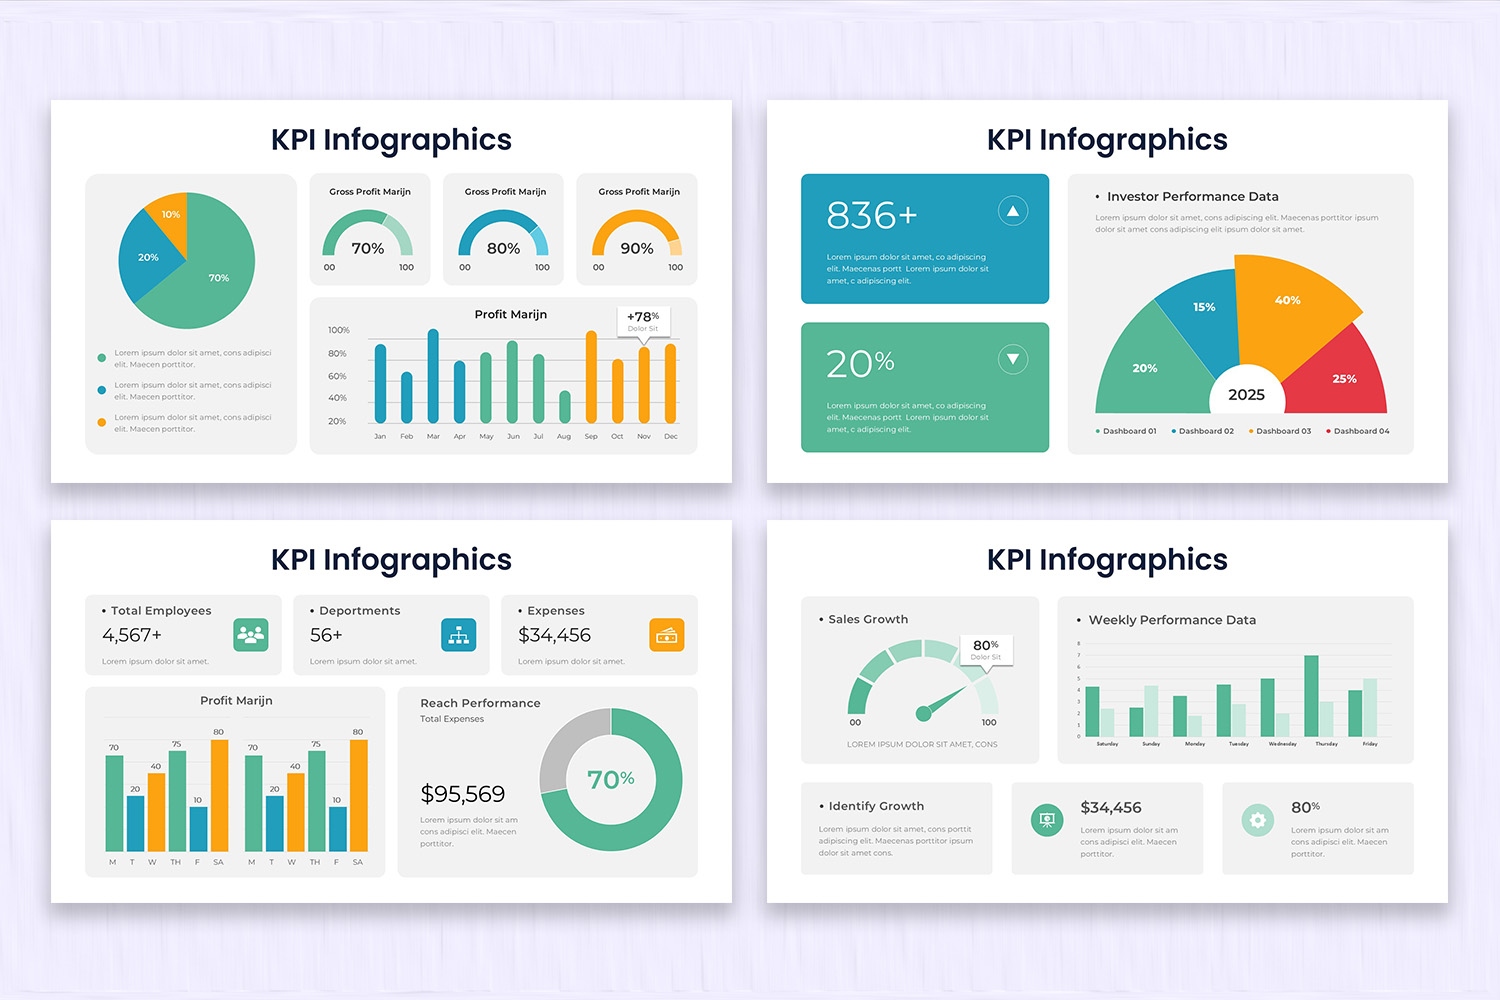
With this template, you can turn raw figures into clear visuals using an infographic Google Slides template designed to make every metric easy to read. Revenue trends, expenses, and performance indicators all become simple to follow.
Professionals will save time while keeping presentations organized and engaging. Each slide is crafted to make financial reports clear, concise, and actionable, helping audiences focus on what truly matters.
Product Features:
- 20+ clean, creative, & modern slides.
- 16 x 9 Widescreen (No more broken slides)
- 1920 x 1080 px (Full HD & retina-ready)
- Based on Master Slides
- PPTX and PPT Files (For both the latest and old versions of PowerPoint)
- Editable Google Slides Theme
- 1500+ Icons (750+ vector icons & 750+ font icons)
- Image Placeholders (Drag-and-drop your photo)
- Elements are fully editable in PowerPoint and Google Slides
- Device mockups included
- Data Charts Editable via Excel
- Interactive and Easily Editable Maps
- Easy Editable Colors
- Fast & Friendly Support
If you have any questions or need support about this product, please contact us. We'll help you!
Check out more Infographic Presentation Templates here.
Product Specs
- Release: Sep 25, 2025
- Last Update: Mar 09, 2026
- Aspect Ratio: Widescreen (16:9)
- Compatibility: Google Slides, PPT, PPTX